|
Talk by Elisabetta Brunella
Secretary General of MEDIA Salles
at the 30th Flanders International Film Festival
Workshop on the Distribution of European Films
Gent, 10 October 2003
I should like to thank the organisers of
this session for their invitation to MEDIA Salles, which participates
in this workshop by presenting a statistical framework with the intention
of facilitating the discussion of today's topic: the circulation of European
films in Europe.
As you know, MEDIA Salles came into being almost 12 years ago - thanks
to an idea which was both simple and innovatory - to record cinema-going
in the theatres of 32 territories in the European continent, from Iceland
to Turkey and from Estonia to Cyprus.
Since then, the results of this work have been recorded each year in the
European Cinema Yearbook, of which a special edition, preceded by an analysis
of the circulation of European films, has been produced especially for
the latest Venice Film Festival and, in particular, for the informal meeting
of the EU Ministers of Culture.
Some figures from this and similar studies carried out by MEDIA Salles
- for example on the occasion of the conference "The Taste of Others",
held from 5-6 December 2002 in Rome - will help us to provide a framework
for today's debate.
No-one challenges the fact that films can offer a window on the world,
a way of discovering how others live. Whether or not this potential is
translated into facts is, instead, far less certain.
One of the many ways to form an idea of how far the cinema is truly a
vehicle of multiculturalism is to analyse where and to what extent films
are produced and where and to what extent they are seen, in particular
to what extent they manage to travel outside their country of origin.
What is happening in the cinemas of Europe?
If we take as our reference point the countries analysed by MEDIA Salles,
we can see that in 2002 the figures available, in some cases estimates,
show that there were 967 million spectators in the 18 countries of Western
Europe and 101 million in the 14 countries of Central and Eastern Europe
and the Mediterranean Rim.
Table 1: Admissions in Europe
| WESTERN EUROPE |
1995 |
1996 |
1997 |
1998 |
1999 |
2000 |
2001 |
2002 |
Var %
95/02 |
Var %
98/02 |
| 684 092 |
732 773 |
787 205 |
845 542 |
833 850 |
867 123 |
957 717 |
967 055 |
+41.4% |
+14.4% |
CENTRAL AND EASTERN
EUROPE
AND MEDITERRANEAN RIM |
1998 |
1999 |
2000 |
2001 |
2002 |
Var %
98/02
|
| 97 597 |
97 431 |
94 485 |
106 183 |
101 086 |
+3.6%
|
| TOTAL |
1998 |
2002 |
Var %
98/02 |
| 943 139 |
1 068 141 |
+ 13,3% |
Admissions (x 1000)
And although in 2002 Western Europe recorded an increase
in the number of tickets sold compared to 2001, whilst the rest of the
continent saw a drop in audiences of around 5%, if we look at the trend
from 1998 to 2002, we see that, to varying degrees, Europe has seen an
increase in audiences (943 million tickets in 1998, 1 billion, 100 million
in 2002, or +13.3%).
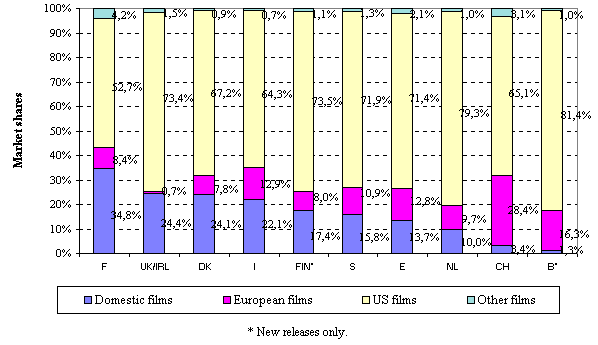
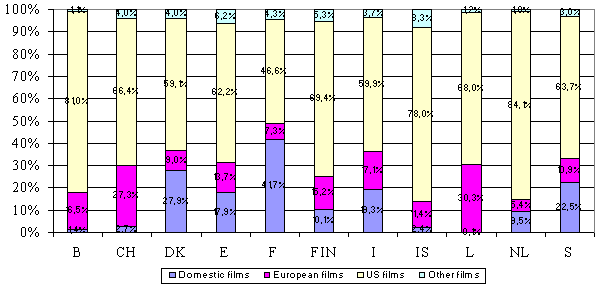
An analysis of the market shares obtained by films according to their
nationality shows that on average Europeans everywhere have seen a large
number of US films, in some countries a fair number of domestic films
and almost everywhere few films from neighbouring countries.
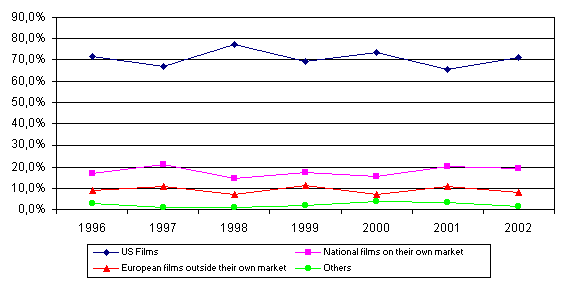
Graph 1 and Table 2: Breakdown of Admissions
in the European Union according to Origin of Film
| |
1996 |
1997 |
1998 |
1999 |
2000 |
2001 |
2002 |
| US Films |
71,6% |
67,0% |
77,5% |
69,2% |
73,3% |
65,4% |
71,2% |
| National films on their own market |
17,1% |
21,3% |
14,4% |
17,5% |
15,7% |
20,1% |
19,5% |
| European films outside their own market |
8,8% |
10,7% |
7,1% |
11,3% |
7,2% |
11,0% |
7,9% |
| Others |
2,6% |
1,1% |
1,1% |
2,0% |
3,8% |
3,5% |
1,3% |
Over the past 7 years in the European Union, between 65 and 77 spectators
out of 100 have seen a film made in the USA, between 14 and 21 a film
from their own country, between 7 and 11 a production by their European
neighbours. No more than 4, but some years only 1, have chosen a film
from the rest of the world. Nevertheless, the differences between one
country and another and in individual years are quite pronounced, as emerges
from the following four graphs.
Graph 2: Market Shares according to Origin of Films in Western
Europe - 2002
Graph 3: Market Shares according to Origin
of Films in Western Europe - 2001
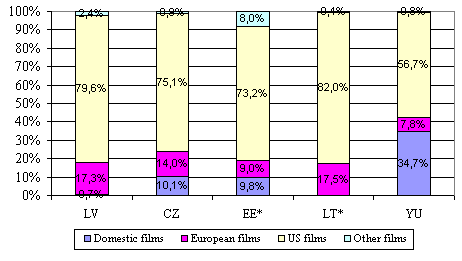
Graph 4: Market Shares according to Origin
of Films in Central and Eastern Europe - 2002
Graph 5: Market Shares according to Origin
of Films in Central and Eastern Europe and the Mediterranean Rim - 2002
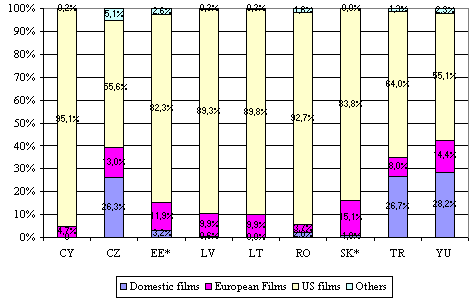
* New releases only.
TR: percentage on admissions
Focusing in particular on
the graph mentioned, which shows the breakdown of admissions in the European
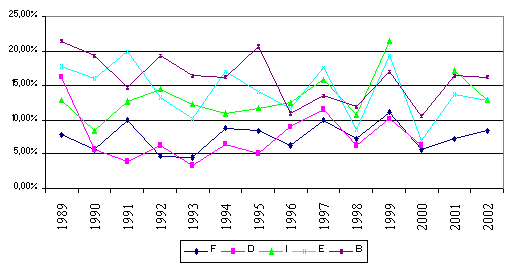
Union according to the origin of films, a two-yearly cycle can be seen
for non-domestic European films (1)
which, in 1997, 1999 and 2001, manage to cross the 10% threshold in the
European Union.
This trend, marked by peaks and troughs, also appears in graph 6.
Graph 6 and Table 3: Market Shares of European
Films (excluding domestic films)
| |
1989 |
1990 |
1991 |
1992 |
1993 |
1994 |
1995 |
1996 |
1997 |
1998 |
1999 |
2000 |
2001 |
2002 |
| F |
7,8% |
5,7% |
10,0% |
4,7% |
4,4% |
.8,7% |
8,4% |
6,2% |
10,0% |
7,2% |
11,1% |
5,6% |
7,3% |
8,4% |
| D |
16,3% |
5,6% |
4,0% |
6,2% |
3,4% |
6,5% |
5,1% |
8,9% |
11,5% |
6,3% |
10,2% |
6,2% |
. |
. |
| I |
12,8% |
8,4% |
12,6% |
14,2% |
12,4% |
11,0% |
11,7% |
12,5% |
15,9% |
10,8% |
21,4% |
11,5% |
17,1% |
12,9% |
| E |
17,7% |
16,1% |
20,0% |
13,2% |
10,1% |
16,9% |
14,1% |
11,8% |
17,6% |
8,5% |
19,3% |
7,0% |
13,7% |
12,8% |
| B |
21,5% |
19,3% |
14,7% |
19,3% |
16,5% |
16,2% |
20,8% |
10,9% |
13,4% |
11,9% |
17,0% |
10,5% |
16,5% |
16,3% |
| CH |
23,0% |
18,0% |
19,0% |
28,9% |
22,3% |
16,3% |
24,0% |
24,3% |
21,0% |
21,7% |
20,1% |
20,0% |
27,3% |
28,4% |
| DK |
19,4% |
6,1% |
4,7% |
3,4% |
5,2% |
6,9% |
7,4% |
15,3% |
13,1% |
9,1% |
15,1% |
8,1% |
9,0% |
7,8% |
| FIN |
24,0% |
12,5% |
13,0% |
25,0% |
20,0% |
20,0% |
11,2% |
15,7% |
18,6% |
8,5% |
15,3% |
9,9% |
15,2% |
8,0% |
| NL |
18,2% |
5,0% |
3,0% |
3,0% |
4,9% |
7,1% |
7,5% |
3,6% |
10,5% |
3,9% |
14,3% |
4,8% |
5,4% |
9,7% |
| S |
. |
. |
. |
5,3% |
9,4% |
13,2% |
11,4% |
11,9% |
14,9% |
8,7% |
10,3% |
6,7% |
10,9% |
10,9% |
| UK |
. |
. |
1,9% |
0,8% |
1,3% |
. |
6,1% |
. |
. |
2,0% |
. |
. |
. |
0,7% |
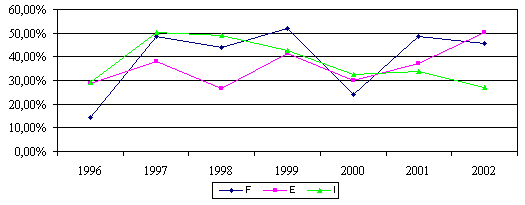
The trend should be compared to the observation of another phenomenon,
i.e. the concentration of admissions to European films for the 3 titles
most widely seen.
This concentration can reach decidedly high levels, as appears in the
following tables
Graph 7 and Table 4: Density of Admissions to top three
European Titles
| |
Top 3 European films |
| |
1996 |
1997 |
1998 |
1999 |
2000 |
2001 |
2002 |
| F |
14,20% |
48,80% |
44,00% |
52,10% |
23,90% |
48,50% |
45,60% |
| E |
28,70% |
37,90% |
26,60% |
41,20% |
30,00% |
37,10% |
50,20% |
| I |
29,30% |
50,20% |
49,20% |
42,50% |
32,60% |
33,90% |
27,20% |
In 2002, for example, the density reached 27.2% in Italy, 45.6% in France,
50.2% in Spain. In other words, the fortunes of so-called "non-domestic"
European films seem to be linked to a few, or very few, "attractions".
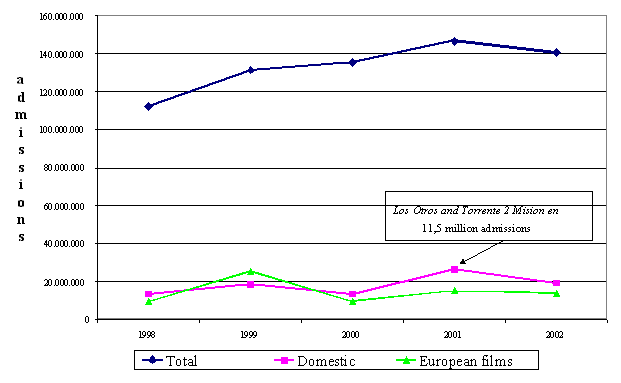
If, in 1999, non-domestic European films in Spain reached the exceptional
share of 19.3% (25.2 million tickets), the merit is largely due to a handful
of highly successful titles, such as "La vita è bella", "Notting Hill",
"Astérix et Obélix contre César".
Graph 8: Share of Admissions according to Origin of Films:
Spain
If it is true that Europeans do not, generally
speaking, see many films by other Europeans, in 2002, the largest market
shares by non-domestic European films were to be found in Switzerland
(28.4%) - which enjoys a unique linguistic and cultural make-up, resulting
in the fact that films in Italian, French and German are all perceived
to some extent as "domestic" - in Belgium (16.3%), in Spain (12.8%) and
in Italy (12.9%), what is more striking is the "irregularity" in the amounts
(peaks in admissions - concentration on very few titles) as well as in
space and time.
Let us follow the "journey" (in other words the results obtained in the
various European territories) of the five European films which, according
to the European Audiovisual Observatory, obtained most admissions in 2001.
Let us look at their career in 2002, as well, and, where possible, in
2003.
To elaborate this picture, which also includes tickets sold in the films'
countries of origin, we have used data from the European Audiovisual Observatory
(which covers 70% of the market) and from MEDIA Salles, where our sources
manage to cover the whole market.
As far as space is concerned, we can see that not all of these "European
champions" have experienced truly international distribution.
Table 5: Top five Films according to Admissions
in Europe in 2001
| |
Bridget Jones' s Diary
|
Le Fabuleux Destin
D'Amélie Poulain
|
Der Schuh des Manitu
|
The Others
|
Chocolat
|
| A |
459 413
|
215 879
|
1 948 432
|
|
205 138
|
| B |
600 054
|
525 941
|
|
|
183 125
|
| BG |
25 579
|
|
|
|
14 901
|
| CH |
451 519
|
578 316
|
340 321
|
5 927
|
324 739
|
| CY |
13 013
|
|
|
|
5 931
|
| CZ |
292 196
|
95 184
|
|
|
100 886
|
| D |
4 133 963
|
2 522 427
|
10 526 676
|
|
2 968 830
|
| DK |
381 299
|
|
|
|
77 037
|
| EE |
39 313
|
|
|
|
9 002
|
| E |
3 230 935
|
1 238 508
|
|
6 242 330
|
1 941 836
|
| FIN |
294 759
|
65 144
|
|
|
103 762
|
| F |
3 478 852
|
8 190 917
|
|
434 397
|
625 521
|
| UK |
9 723 791
|
1 000 107
|
|
2 646 656
|
|
| GR |
|
22 786
|
|
146 413
|
|
| HU |
439 977
|
|
|
|
152 003
|
| IS |
51 065
|
7 736
|
|
13 382
|
4 105
|
| I |
2 301 479
|
|
|
1 456 341
|
1 487 641
|
| LT |
61 786
|
|
|
|
|
| L |
39 000
|
35 057
|
19 550
|
|
19 850
|
| LV |
21 992
|
|
|
|
6 198
|
| NL |
1 068 431
|
49 886
|
|
195 038
|
137 036
|
| N |
577 827
|
113 088
|
|
|
86 403
|
| PL |
1 061 416
|
396 476
|
|
|
75 752
|
| P |
|
43 230
|
|
|
|
| RU |
|
175 972
|
|
|
|
| S |
789 702
|
185 089
|
|
|
291 848
|
| SI |
92 038
|
|
|
|
|
| TR |
340 162
|
133 519
|
|
58 484
|
237 478
|
| US |
13 273 363
|
3 025 408
|
|
17 907 734
|
12 478 734
|
Table 6: Top five Films according to Admissions in Europe
in 2001 (number of admissions in 2002)
| |
Bridget Jones' s Diary
|
Le Fabuleux Destin D'Amélie Poulain
|
Der Schuh des Manitu
|
The Others
|
Chocolat
|
| A |
|
|
35 255
|
|
|
| B |
|
|
|
266 249
|
|
| BG |
|
|
|
|
|
| CH |
3 765
|
92 316
|
340 321
|
123 748
|
1 911
|
| CY |
133
|
3 298
|
|
10 585
|
|
| CZ |
|
|
|
28 134
|
|
| D |
|
614 643
|
1 134 507
|
705 065
|
|
| DK |
1 620
|
147 507
|
|
56 436
|
293
|
| EE |
|
21 601
|
|
10 521
|
|
| E |
|
|
1 227
|
|
|
| FIN |
|
|
|
|
|
| F |
18 455
|
440 535
|
|
1 130 314
|
|
| UK |
|
|
|
|
|
| GR |
|
|
|
|
|
| HU |
|
|
|
|
|
| IS |
|
|
|
|
|
| I |
45 247
|
1 447 115
|
|
10 152
|
534
|
| LT |
|
|
|
|
|
| L |
|
2 343
|
|
|
|
| LV |
|
|
|
11 180
|
|
| NL |
|
|
|
|
|
| N |
|
47 088
|
|
73 949
|
|
| PL |
|
|
|
305 957
|
|
| P |
|
|
|
|
|
| RU |
|
|
|
|
|
| S |
|
|
|
186 488
|
|
| SI |
|
48 188
|
|
|
|
| TR |
|
|
|
|
|
| US |
|
2 905 826
|
|
|
|
If Amélie drew audiences in 23 European countries outside France,
Der Schuh des Manitu was only released in two other countries outside
Germany in 2001 - and these were German-speaking. In other words, as the
following table shows, it obtained 82% of its admissions at home in 2001
and 95% in 2002. This situation may improve slightly following its distribution
in Poland and in Turkey in 2003.
Table 7: Der Schuh des Manitu (Germany - 2001)
|
|
2001
|
2002
|
2003
Release date
|
| A |
1 948 432
|
35 255
|
|
| CH |
340 321
|
22 448
|
|
| D |
10 526 676
|
1 134 507
|
|
| EE |
|
1 227
|
|
| L |
19 550
|
|
|
| PL |
|
|
21 February
|
| TR |
|
|
2 May
|
| Japan |
|
|
5 July
|
| TOTAL |
12 834 979
|
1 193 437
|
|
| |
of which:
|
of which:
|
|
|
82% in Germany
|
95% in Germany
|
In terms of time, we can see that European films hardly ever manage to
achieve "simultaneous" international circulation.
The following figures, which show the circulation of Billy Elliott,
Dancer in the Dark and Les Rivières Pourpres, point to a sort
of "disharmony" in release dates.
Table 8:
BILLY ELLIOT (UK, 2000)
| |
2000
|
2001
|
2002
|
| A |
27 982
|
49 745
|
|
| B |
|
249 447
|
|
| BG |
|
5 333
|
|
| CH |
111 999
|
343 497
|
|
| CY |
|
1 766
|
|
| CZ |
|
32 480
|
|
| D |
549 178
|
824 057
|
|
| DK |
|
68 665
|
2 049
|
| E |
250 464
|
1 935 227
|
|
| FR |
257 958
|
2 278 036
|
|
| UK |
3 893 407
|
|
|
| GR |
|
221 073
|
|
| HU |
|
25 252
|
|
| IS |
|
9 534
|
|
| I |
|
1 154 600
|
2 652
|
| L |
|
17 350
|
|
| LV |
|
3 664
|
|
| NL |
5 696
|
152 718
|
|
| PL |
|
71 670
|
|
| P |
|
95 757
|
|
| S |
13 773
|
|
|
| SI |
|
33 708
|
|
| TR |
|
50 943
|
|
| US |
3 108 219
|
909 101
|
|
| Total year |
8 218 676
|
8 533 623
|
4 701
|
Table 9:
DANCER IN THE DARK (DK, D, NL, F - 2000)
| |
2000
|
2001
|
2002
|
| A |
34 470
|
6 495
|
|
| B |
120 171
|
13 619
|
|
| BG |
|
3 540
|
|
| CH |
123 151
|
8 545
|
|
| CZ |
17 438
|
|
|
| D |
314 517
|
70 837
|
|
| DK |
195 593
|
7 034
|
111
|
| EE |
|
4 030
|
|
| E |
323 254
|
88 651
|
|
| FIN |
39 774
|
7 857
|
|
| F |
1 115 000
|
120 076
|
|
| UK |
94 464
|
|
|
| HU |
|
35 539
|
|
| IRL |
5 387
|
|
|
| IS |
9 862
|
50
|
|
| I |
255 546
|
|
|
| L |
5 515
|
168
|
|
| LV |
39 100
|
3 517
|
|
| NL |
85 086
|
39 125
|
|
| N |
62 156
|
|
|
| PL |
130 104
|
44 906
|
|
| P |
73 264
|
4 072
|
|
| RU |
111 906
|
26 933
|
|
| S |
82 910
|
9 377
|
|
| SI |
2 576
|
|
|
| TR |
47 419
|
|
|
| US |
755 907
|
|
|
| Total year |
4 044 570
|
494 375
|
111
|
Table 10:
LES RIVIÈRES POURPRES (F, 2000)
| |
2000
|
2001
|
2002
|
| A |
|
47 010
|
|
| B |
156 860
|
|
|
| BG |
|
23 021
|
|
| CH |
68 455
|
19 938
|
|
| CY |
|
2 160
|
|
| CZ |
|
73 264
|
|
| D |
|
819 246
|
|
| DK |
|
17 015
|
|
| EE |
|
10 354
|
|
| E |
|
435 483
|
|
| F |
3 180 000
|
40 934
|
|
| UK |
|
15 203
|
|
| HU |
|
109 084
|
|
| IS |
|
5 367
|
|
| I |
1 146 171
|
8 806
|
67
|
| L |
9 650
|
50
|
|
| RU |
|
143 920
|
|
| S |
|
48 253
|
|
| Total year |
4 561 136
|
1 819 126
|
67
|
We have seen some very fluid trends. But is there any sign of something
stable?
Without doubt the leading role of French and English films. The following
tables, which show the situation of European films both on the large markets
such as Spain, Italy, or France and on smaller ones such as the Czech
Republic or Hungary, indicate that, despite clear variations, French and
English productions are general at the top of the classifications. Italian
films tend to resemble the course of rivers in the desert which at times
disappear and at others reappear, sometimes in full force.
Table 11:
Share of Admissions according to Origin of Films: Spain
|
|
1998
|
1999
|
2000
|
2001
|
2002
|
1998
|
1999
|
2000
|
2001
|
2002
|
Total
admissions |
112 143 150
|
131 348 075
|
135 390 513
|
146 810 494
|
140 716 354
|
100,00%
|
100,00%
|
100,00%
|
100,00%
|
100,00%
|
Domestic
films |
13 298 730
|
18 152 855
|
13 437 776
|
26 205 964
|
19 018 156
|
11,90%
|
13,80%
|
9,90%
|
17,90%
|
13,50%
|
Total
European
films |
9 564 983
|
25 153 600
|
9 490 642
|
15 147 474
|
13 629 650
|
8,50%
|
19,20%
|
7,00%
|
10,30%
|
9,70%
|
| of which: |
|
|
|
|
|
|
|
|
| F |
991 466
|
4 138 484
|
2 108 862
|
5 066 216
|
5 217 593
|
10,40%
|
16,50%
|
22,20%
|
33,40%
|
38,30%
|
| UK |
6 474 170
|
14 151 927
|
4 929 000
|
7 929 792
|
7 387 386
|
67,70%
|
56,30%
|
51,90%
|
52,40%
|
54,20%
|
| I |
305 491
|
4 618 368
|
302 343
|
429 782
|
106 138
|
3,20%
|
18,40%
|
3,20%
|
2,80%
|
0,80%
|
| DK |
75 248
|
166 097
|
375 107
|
348 888
|
200 474
|
0,80%
|
0,70%
|
4,00%
|
2,30%
|
1,50%
|
| IRL |
644 373
|
255 220
|
273 763
|
23 238
|
43 144
|
6,70%
|
1,00%
|
2,90%
|
0,20%
|
0,30%
|
| S |
48 140
|
70 527
|
120 925
|
73 737
|
25 224
|
0,50%
|
0,30%
|
1,30%
|
0,50%
|
0,20%
|
| D |
482 898
|
774 080
|
1 103 393
|
1 237 485
|
644 774
|
5,00%
|
3,10%
|
11,60%
|
8,20%
|
4,70%
|
| B |
1 176
|
48 957
|
144 500
|
19 467
|
2 538
|
0,00%
|
0,20%
|
1,50%
|
0,10%
|
0,00%
|
| L |
-
|
889 298
|
13 869
|
-
|
-
|
-
|
3,50%
|
0,10%
|
-
|
-
|
| A |
-
|
11 652
|
8 092
|
4 975
|
623
|
0,00%
|
0,00%
|
0,10%
|
0,00%
|
0,00%
|
| FIN |
5 920
|
361
|
-
|
-
|
357
|
0,10%
|
0,00%
|
-
|
-
|
0,00%
|
| P |
-
|
230
|
542
|
9 304
|
1 117
|
-
|
0,00%
|
0,00%
|
0,10%
|
0,00%
|
| NL |
99 425
|
28 399
|
110 246
|
4 590
|
282
|
1,00%
|
0,10%
|
1,20%
|
0,00%
|
0,00%
|
Other
European
f ilms |
436 676
|
-
|
-
|
-
|
-
|
4,60%
|
0,00%
|
0,00%
|
0,00%
|
0,00%
|
Total
European
films |
9 564 983
|
25 153 600
|
9 490 642
|
15 147 474
|
13 629 650
|
100,00%
|
100,00%
|
100,00%
|
100,00%
|
100,00%
|
Table 12:
Share of Admissions according to Origin of Films: Italy
| |
1998
|
1999
|
2000
|
2001
|
2002
|
1998
|
1999
|
2000
|
2001
|
2002
|
| Total admissions |
77 133 567
|
68 994 075
|
74 536 576
|
86 749 550
|
89 176 811
|
100,00%
|
100,00%
|
100,00%
|
100,00%
|
100,00%
|
| Domestic films |
18 092 578
|
16 625 590
|
13 103 018
|
18 894 761
|
19 787 247
|
23,50%
|
24,10%
|
17,60%
|
21,80%
|
22,20%
|
| Total European films |
8 351 375
|
15 033 947
|
8 694 892
|
14 518 017
|
11 625 922
|
10,80%
|
21,80%
|
11,70%
|
16,70%
|
13,00%
|
| of which: |
| F |
1 345 216
|
1 882 340
|
4 333 367
|
3 326 135
|
5 657 651
|
16,10%
|
12,50%
|
49,80%
|
22,90%
|
48,70%
|
| UK |
6 085 290
|
9 548 459
|
2 494 183
|
8 734 879
|
3 433 886
|
72,90%
|
63,50%
|
28,70%
|
60,20%
|
29,50%
|
| E |
76 562
|
1 342 317
|
199 886
|
1 421 154
|
1 220 397
|
0,90%
|
8,90%
|
2,30%
|
9,80%
|
10,50%
|
| DK |
61 261
|
207 211
|
277 260
|
16 089
|
102 266
|
0,70%
|
1,40%
|
3,20%
|
0,10%
|
0,90%
|
| S |
70 583
|
1 503
|
59 014
|
271 663
|
17 549
|
0,80%
|
0,00%
|
0,70%
|
1,90%
|
0,20%
|
| D |
87 093
|
300 464
|
852 155
|
653 563
|
964 641
|
1,00%
|
2,00%
|
9,80%
|
4,50%
|
8,30%
|
| FIN |
-
|
19 134
|
1 167
|
-
|
71 961
|
-
|
0,10%
|
0,00%
|
-
|
0,60%
|
| GR |
-
|
-
|
7 088
|
-
|
-
|
-
|
-
|
0,10%
|
-
|
-
|
| B |
-
|
24 225
|
94 762
|
13 967
|
617
|
-
|
0,20%
|
1,10%
|
0,10%
|
0,00%
|
| N |
-
|
1 181
|
-
|
-
|
50 872
|
-
|
0,00%
|
-
|
-
|
0,40%
|
| PL |
67 214
|
668
|
6 448
|
-
|
3 375
|
0,80%
|
0,00%
|
0,10%
|
-
|
0,00%
|
| TR |
-
|
-
|
16 373
|
310
|
33 323
|
-
|
-
|
0,20%
|
0,00%
|
0,30%
|
| RU |
-
|
6 422
|
14 803
|
231
|
48 469
|
-
|
0,00%
|
0,20%
|
0,00%
|
0,40%
|
| P |
-
|
5 506
|
17 823
|
4 059
|
192
|
-
|
0,00%
|
0,20%
|
0,00%
|
0,00%
|
| NL |
-
|
3 382
|
31 071
|
-
|
160
|
-
|
0,00%
|
0,40%
|
-
|
0,00%
|
| Other European films |
558 156
|
1 691 135
|
289 492
|
75 967
|
20 563
|
6,70%
|
11,20%
|
3,30%
|
0,50%
|
0,20%
|
| Total European films |
8 351 375
|
15 033 947
|
8 694 892
|
14 518 017
|
11 625 922
|
100,00%
|
100,00%
|
100,00%
|
100,00%
|
100,00%
|
Table 13: Share of Admissions according to
Origin of Films: France

Source: MEDIA Salles elaboration of CNC data
We can see that, from the data provided by
the CNC, over the past five years Italy's share of the non-domestic European
films seen in France is fairly low, with an exception in 1998. Of the
roughly 3.6 million French spectators who saw an Italian film that year,
as many as 3.2 million chose the same film, i.e. "La vita è bella".
Once again we witness the same phenomenon observed at a pan-European level,
in the concentration of tickets for European productions on a tiny number
of films with high international appeal.
We can also see that Italian films are generally those most widely seen
by Europeans after British ones.
However, if the UK cinema can count on a number of spectators that - always
given the previously mentioned differences from year to year concerning
European films - remains fairly high, Italian cinema - like Spanish -
follows a trend marked by peaks and dips.
It should be remembered, however, that the previously mentioned tendency
to consider co-productions as domestic films, means that the weight of
non-domestic European films seems to be less than it really is - this
is the case of "La stanza del figlio" which, in the CNC statistics, is
considered a French film.
This choice means that over eight hundred thousand tickets sold by Moretti's
film are missing from the data on the admissions obtained by Italian films
in 2001.
Table 14:
Share of Admissions according to Origin of Films: Czech Republic
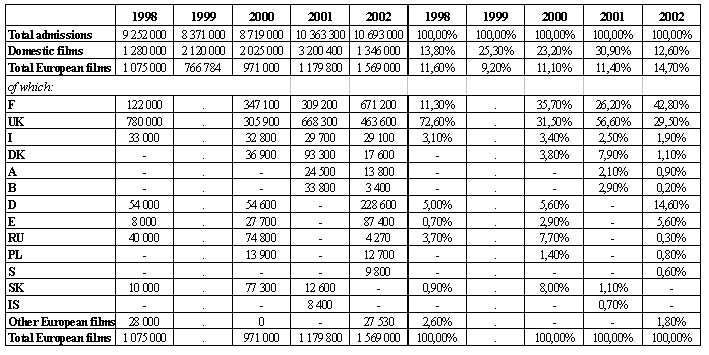
Table 15:
Share of Admissions according to Origin of Films: Hungary
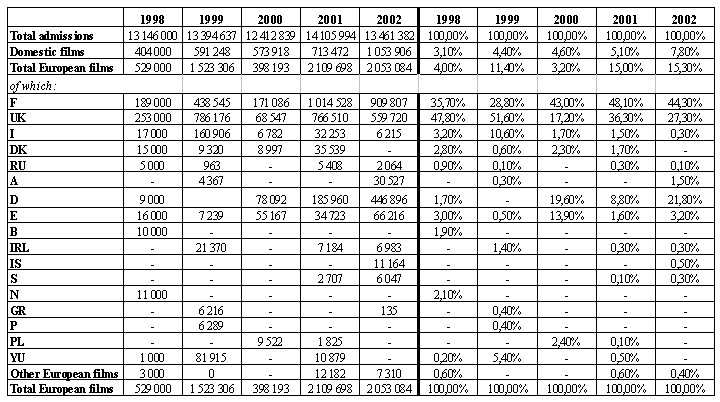
Given this "irregularity", it would seem that
we can confirm our initial statement ("Europeans do not see many films
by other Europeans") but we can also locate the crucial problem, that
is the lack of a constant supply of those products that would make it
possible to at least maintain the rate of admissions found during "peaks"
over time, and which prove that there certainly are Europeans that would
like to see more films by their neighbours.
____________________________________________________________________________________________
Note:
It should be pointed out that the statistics on admissions obtained by
European films suffer from the lack of a definition of "co-production"
shared by all European countries, which sometimes makes it difficult to
distinguish between admissions in the home territory and those outside
it, with frequent over-estimation of domestic shares (cfr. J. PH. WOLFF,
Admissions were up. Was it due to European Films?, "European Cinema Journal",
2002, 3).
|

