|
Talk by Elisabetta
Brunella
Secretary General of MEDIA Salles
at the Conference "Film Exhibition Business"
KINO EXPO 2003
Moscow, 16 September 2003
I should like to thank the organisers of
Kino Expo 2003 for inviting MEDIA Salles to take part in this important
and truly international meeting of the cinema industry.
Before my contribution to the debate, by providing some data and information
on cinema-going in Europe, I shall briefly introduce MEDIA Salles, the
organisation that I represent.
MEDIA Salles - Cinema d'Europa is a non-profit association founded in
1991 under the auspices of the European Union - more precisely of the
MEDIA Programme, on behalf of the audiovisual industry, with the support
of the Italian Government.
MEDIA Salles' members are the associations representing cinema exhibitors
in the industrial and art-house sectors at a national or international
level in Europe.
MEDIA Salles, which has its headquarters in Milan, Italy, has been working
since 1991 on behalf of cinemas and the promotion of European films.
MEDIA Salles is active in three main fields: the promotion of European
films, exhibitor training and information on the cinema industry, in particular
on cinema-going.
In the field of promotion MEDIA Salles organises the 'Focus on Europe'
events at the most important professional meetings of exhibitors and distributors
at an international level.
For some years now the Focus on Europe event organised by MEDIA Salles
in Amsterdam for Cinema Expo has become a regular appointment for the
exhibitors of Western and Central Europe: thanks to Focus on Europe's
opening seminar, they are able to gain information on the most recent
trends in cinema-going and marketing in theatres and thanks to the screenings,
they can become familiar with the European films of international appeal
about to be released on the different markets.
In the sphere of training, MEDIA Salles
promotes the only specific training course for exhibitors at a European
level. Theatre management, marketing techniques, the opportunities and
risks of digital cinema are the main topics of these intensive courses.
The next course will begin in a few days' time (24-28 September) in Rome,
with the collaboration of the Italian and Danish exhibitors' associations,
and of the European Film College. In autumn 2004 a similar course will
be held in Budapest.
And lastly information: in this field MEDIA Salles offers several tools
which aim to bring a better knowledge of the cinema market both to the
operators themselves and to institutions, potential investors and the
press.
The website (www.mediasalles.it) with the special Cinema Research Library
section, the quarterly newsletter European Cinema Journal, distributed
to over ten thousand key professionals and, above all, the European Cinema
Yearbook are the tools used by MEDIA Salles to spread information on the
sector, as well as the results of the Association's research.
It is from this research, collected in the
European Cinema Yearbook, that I would like to start out, providing some
figures on cinema-going in Western Europe (18 countries) and in 14 territories
in Central and Eastern Europe.
In 2002 over 31 000 screens were recorded in this area, of which 26 000
in Western Europe and over 4 000 in Central and Eastern Europe.
Thus a total of screens only slightly lower than that of the United States
which, in 2002, recorded around 35 000 screens.
Tab. 1: NUMBER OF SCREENS WORLDWIDE
| |
1995
|
1996
|
1997
|
1998
|
1999
|
2000
|
2001
|
2002
|
Var %
95/02
|
Var%
00/02
|
| Western Europe |
19 583
|
20 366
|
21 483
|
22 698
|
24 055
|
24 982
|
25 932
|
26 645
|
+36%
|
+6,60%
|
| Eastern Europe |
4 497
|
4 232
|
4 276
|
4 258
|
4 452
|
4 379
|
4 701
|
4 657
|
+4%
|
+6,30%
|
| USA |
27 805
|
29 690
|
31 640
|
34 186
|
37 185
|
37 396
|
36 764
|
35 280
|
+27%
|
-5,70%
|
| Japan |
1 776
|
1 828
|
1 884
|
1 993
|
2 230
|
2 524
|
2 585
|
2 635
|
+48%
|
+4,40%
|
| Australia |
1 137
|
1 251
|
1 431
|
1 576
|
1 748
|
1 817
|
1 855
|
1 872
|
+65%
|
+3%
|
But with one important difference: the European market witnesses an increase
in the number of screens, whilst the US market experiences a dip in 2001
(-5,7% in the 2000-2002 period).
Tab. 2: NUMBER OF SCREENS WORLDWIDE (graph.)
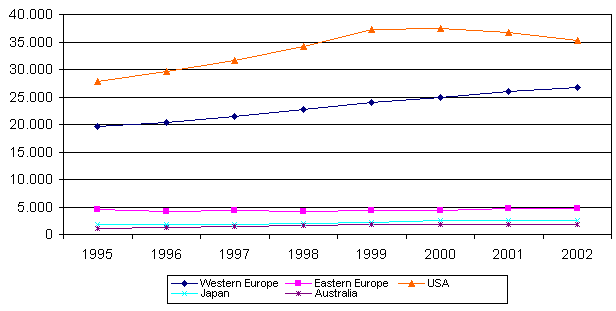
As regards Europe, over the past two years
growth has been identical both in the west and in central-eastern parts.
If, however, we look at the 1995-2000 period, it can be seen that the
growth rates were quite different: +36% in Western Europe, +4% in Central-Eastern
Europe.
Regarding the number of tickets sold, it can immediately be seen that,
unlike the case of screen numbers, the difference in favour of the United
States is decidedly more marked.
Tab. 3: ADMISSIONS WORLDWIDE
|
|
1995
|
1996
|
1997
|
1998
|
1999
|
2000
|
2001
|
2002
|
Var % 95/02
|
|
|
USA |
1 262,6
|
1 338,6
|
1 387,7
|
1 480,7
|
1 465,2
|
1 420,8
|
1 487,3
|
1 639,3
|
+29,8%
|
+29,8%
|
|
JAPAN |
127,0
|
119,6
|
140,7
|
153,1
|
144,7
|
135,4
|
163,3
|
160,8
|
+26,6%
|
+26,6%
|
|
AUSTRALIA |
69,0
|
73,9
|
76,0
|
80,0
|
88,0
|
82,0
|
92,5
|
92,5
|
+34,1%
|
+34,1%
|
Admissions (x 1 000 000)
Tab. 4: ADMISSIONS IN EUROPE
| WESTERN EUROPE |
1995 |
1996 |
1997 |
1998 |
1999 |
2000 |
2001 |
2002 |
Var %
95/02 |
Var %
98/02 |
| 684 092 |
732 773 |
787 205 |
845 542 |
833 850 |
867 123 |
957 717 |
967 055 |
+41.4% |
+14.4% |
CENTRAL AND EASTERN
EUROPE
AND MEDITERRANEAN RIM |
1998 |
1999 |
2000 |
2001 |
2002 |
Var %
98/02
|
| 97 597 |
97 431 |
94 485 |
106 183 |
101 086 |
+3.6%
|
| TOTAL |
1998 |
2002 |
Var %
98/02 |
| 943 139 |
1 068 141 |
+ 13,3% |
Admissions (x 1 000)
In 2002 in the United States 1 639 million
tickets were sold, compared to 1 068 million in the whole of Europe
(+53,5%).
The differences are also quite evident within Europe: from 1995 to 2002
Western Europe grew by 41%, from 1998 to 2002 by 14%; instead Central-Eastern
Europe grew by only 3,6% between 1998 and 2002.
Amongst the phenomena that distinguished Western Europe in the 90s there
is certainly the development of multiplexes, i.e., according to the
definition proposed by MEDIA Salles and adopted as common practice by
several bodies, complexes with at least 8 screens.
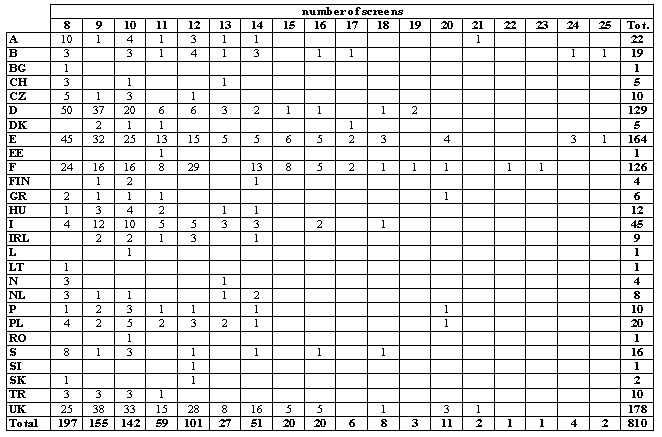
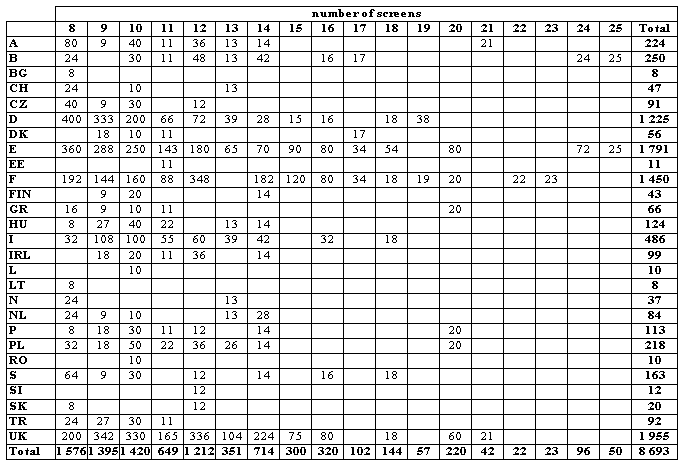
In the following tables we have a "photograph" of the situation on 31
October 2002.
Tab. 5: MULTIPLEXES IN EUROPE - number
of sites (as at 31st October 2002)
Tab. 6: MULTIPLEXES IN EUROPE - number of
screens (as at 31st October 2002)
In the following tables we can see how, to
what extent and how quickly the multiplexes spread in the various European
countries.
Tab. 7: DENSITY OF SCREENS IN MONOSCREEN
CINEMAS, MULTISCREENS AND MULTIPLEXES IN 2001
| |
1 screen
|
2 screens
|
3-5 screens
|
6-7 screens
|
>=8 screens
|
| A |
17,79%
|
11,40%
|
22,45%
|
9,50%
|
38,86%
|
| B |
9,94%
|
7,30%
|
20,89%
|
13,18%
|
48,68%
|
| CH |
51,38%
|
13,78%
|
16,93%
|
8,66%
|
9,25%
|
| D |
18,38%
|
13,36%
|
30,07%
|
12,98%
|
25,21%
|
| DK |
27,70%
|
16,62%
|
26,04%
|
14,13%
|
15,51%
|
| E |
19,80%
|
4,70%
|
19,24%
|
15,32%
|
40,94%
|
| F |
25,09%
|
10,84%
|
26,71%
|
11,09%
|
26,27%
|
| FIN |
51,62%
|
11,21%
|
18,58%
|
5,90%
|
12,68%
|
| GR |
79,52%
|
5,29%
|
4,85%
|
-
|
10,35%
|
| I |
58,79%
|
10,51%
|
15,88%
|
3,13%
|
11,69%
|
| L |
32,00%
|
8,00%
|
20,00%
|
-
|
40,00%
|
| N |
47,21%
|
12,18%
|
24,87%
|
6,35%
|
9,39%
|
| NL |
6,55%
|
14,51%
|
55,22%
|
11,33%
|
12,39%
|
| S |
60,05%
|
6,30%
|
15,08%
|
4,68%
|
13,88%
|
Tab. 8: DENSITY OF SCREENS IN MULTIPLEXES
|
|
1991
|
1992
|
1993
|
1994
|
1995
|
1996
|
1997
|
1998
|
1999
|
2000
|
2001
|
|
A
|
-
|
-
|
2,06%
|
4,43%
|
.
|
12,11%
|
16,04%
|
20,28%
|
28,83%
|
33,27%
|
38,86%
|
|
B
|
21,68%
|
24,59%
|
31,05%
|
32,27%
|
35,12%
|
37,10%
|
41,47%
|
42,66%
|
43,50%
|
43,99%
|
48,68%
|
|
CH
|
-
|
-
|
4,08%
|
3,51%
|
2,05%
|
2,04%
|
3,58%
|
3,47%
|
5,94%
|
9,42%
|
9,25%
|
|
D
|
4,02%
|
4,57%
|
6,61%
|
.
|
.
|
.
|
.
|
17,07%
|
20,30%
|
23,08%
|
25,21%
|
|
DK
|
5,69%
|
5,40%
|
6,13%
|
5,41%
|
8,74%
|
7,76%
|
8,13%
|
7,85%
|
7,85%
|
12,57%
|
15,51%
|
|
E
|
3,60%
|
3,71%
|
4,16%
|
6,67%
|
9,94%
|
10,46%
|
13,20%
|
21,42%
|
31,84%
|
35,40%
|
40,94%
|
|
F
|
.
|
6,49%
|
7,09%
|
7,69%
|
9,87%
|
12,38%
|
15,20%
|
17,30%
|
21,57%
|
24,32%
|
26,27%
|
|
FIN
|
.
|
.
|
.
|
.
|
.
|
.
|
.
|
3,02%
|
9,39%
|
9,91%
|
12,68%
|
|
GR
|
.
|
.
|
.
|
.
|
.
|
.
|
5,59%
|
7,50%
|
12,37%
|
14,83%
|
10,35%
|
|
I
|
0,36%
|
0,46%
|
0,46%
|
0,45%
|
0,44%
|
0,43%
|
2,20%
|
3,13%
|
4,40%
|
7,36%
|
11,69%
|
|
IRL
|
11,46%
|
16,93%
|
17,39%
|
15,92%
|
20,81%
|
27,44%
|
30,70%
|
27,97%
|
33,11%
|
31,63%
|
30,75%
|
|
L
|
-
|
-
|
-
|
-
|
-
|
-
|
38,46%
|
47,62%
|
47,62%
|
40,00%
|
40,00%
|
|
N
|
6,78%
|
7,11%
|
7,25%
|
7,61%
|
7,61%
|
7,59%
|
9,37%
|
9,41%
|
9,30%
|
9,46%
|
9,39%
|
|
NL
|
-
|
-
|
-
|
-
|
3,49%
|
3,45%
|
3,41%
|
6,40%
|
6,35%
|
12,46%
|
12,39%
|
|
P
|
3,61%
|
4,31%
|
.
|
4,02%
|
6,74%
|
12,07%
|
15%
|
15%
|
16%
|
16%
|
18,91%
|
|
S
|
.
|
9,89%
|
.
|
.
|
13,36%
|
12,70%
|
12,71%
|
12,68%
|
12,91%
|
12,84%
|
13,88%
|
|
UK
|
.
|
25,13%
|
24,53%
|
27,30%
|
27,56%
|
30,88%
|
38,92%
|
46,27%
|
51,03%
|
53,93%
|
56,22%
|
Within Western Europe itself marked differences
are to be seen.
In countries like Belgium and Great Britain multiplexes developed earlier
than they did in Spain and far earlier than in Italy. On some markets
the percentage of screens in multiplexes is now over 40% of total screen
numbers (Luxembourg, Spain, Belgium, Great Britain).
In some countries the more traditional type of cinema (the single-screen
theatre) has more or less disappeared (e.g. The Netherlands, 6,6% and
Belgium, 10%), whilst in others it still plays an important role (e.g.
Greece, 80%).
It is even more interesting to observe the performance of screens in
multiplexes and the density of admissions to these screens.
Tab. 9: MULTIPLEXES: CONCENTRATION OF
ADMISSIONS AND DENSITY OF SCREENS
(Western, Central and Eastern Europe)
| |
1998
|
1999
|
2000
|
2001
|
| |
density of screens
|
concentration
of admissions
|
density of screens
|
concentration
of admissions
|
density of screens
|
concentration
of admissions
|
density of screens
|
concentration
of admissions
|
| A |
20,28%
|
.
|
28,83%
|
.
|
33,27%
|
48,47%
|
38,86%
|
63,09%
|
| B |
42,66%
|
68,21%
|
43,50%
|
73,30%
|
43,99%
|
75,05%
|
48,68%
|
74,45%
|
| CH |
3,47%
|
5,27%
|
5,94%
|
.
|
9,42%
|
.
|
9,25%
|
.
|
| D |
17,07%
|
29,36%
|
20,30%
|
32,80%
|
23,08%
|
37,52%
|
25,21%
|
39,74%
|
| DK |
7,85%
|
16,78%
|
7,85%
|
16,71%
|
12,57%
|
24,97%
|
15,51%
|
27,55%
|
| E |
21,42%
|
29,82%
|
31,84%
|
37,68%
|
35,40%
|
47,56%
|
40,94%
|
53,39%
|
| F |
17,30%
|
30,75%
|
21,57%
|
36,18%
|
24,32%
|
41,15%
|
26,27%
|
45,16%
|
| FIN |
3,02%
|
.
|
9,39%
|
30,10%
|
9,91%
|
36,99%
|
12,68%
|
37,76%
|
| I |
3,13%
|
4,24%
|
4,40%
|
7,37%
|
7,36%
|
12,75%
|
11,69%
|
16,58%
|
| IRL |
27,97%
|
.
|
33,11%
|
.
|
31,63%
|
44,96%
|
30,75%
|
.
|
| L |
47,62%
|
79,74%
|
47,62%
|
80,95%
|
40,00%
|
78,76%
|
40,00%
|
76,05%
|
| N |
9,41%
|
20,61%
|
9,30%
|
21,09%
|
9,46%
|
21,02%
|
9,39%
|
20,65%
|
| NL |
6,40%
|
8,89%
|
6,35%
|
11,30%
|
12,46%
|
15,22%
|
12,39%
|
20,23%
|
| S |
12,68%
|
37,90%
|
12,91%
|
38,60%
|
12,84%
|
31,64%
|
13,88%
|
37,84%
|
| UK |
46,27%
|
.
|
51,03%
|
.
|
53,93%
|
.
|
56,22%
|
.
|
|
|
|
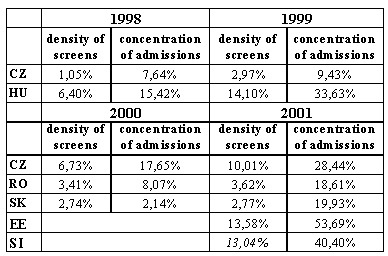
It can thus be seen that in Sweden and Finland
the ratio between these two indicators is almost 1 to 3, in Denmark
and Luxembourg almost 1 to 2. This seems to be a characteristic of the
smaller markets.
Let us look at the bigger markets (those with at least 100 million tickets
sold).
The degree of efficiency of multiplexes in France and Germany is fairly
high. It is not so high in Spain.
Some other interesting observations emerge from a comparison of the
change in the number of screens in multiplexes, the number of screens
in general and the number of tickets sold.
Not in all countries is the percentage increase in ticket sales the
same as, or higher than, the percentage increase in screen numbers.
This happens in Belgium and France but not in Italy.
In Central-Eastern Europe admissions increased more than screen numbers
in the Czech Republic, Hungary and Poland.
Tab. 10: THE EVOLUTION OF ADMISSIONS, SCREENS
AND SCREENS IN MULTIPLEXES
(Western Europe)
| |
1991
|
2001
|
Var % 01/91
|
| B |
Number of screens in multiplexes |
93
|
240
|
+ 158%
|
| Number of total screens |
429
|
493
|
+ 15%
|
| Total admissions in the country |
16 535 146
|
24 000 000
|
+ 45%
|
| D |
Number of screens in multiplexes |
149
|
1 208
|
+ 711%
|
| Number of total screens |
3 706
|
4 792
|
+ 29%
|
| Total admissions in the country |
120 000 700
|
177 925 484
|
+ 48%
|
| I |
Number of screens in multiplexes |
8
|
374
|
+ 4 575%
|
| Number of total screens |
2 241
|
3 198
|
+ 43%
|
| Total admissions in the country |
84 851 197
|
105 537 586
|
+ 24%
|
| |
1992
|
2001
|
Var % 01/92
|
| E |
Number of screens in multiplexes |
65
|
1 534
|
+ 2 260%
|
| Number of total screens |
1 807
|
3 747
|
+ 107%
|
| Total admissions in the country |
83 301 640
|
146 810 494
|
+ 76%
|
| F |
Number of screens in multiplexes |
279
|
1 377
|
+ 394%
|
| Number of total screens |
4 297
|
5 241
|
+ 22%
|
| Total admissions in the country |
115 995 000
|
185 816 369
|
+ 60%
|
| UK |
Number of screens in multiplexes |
443
|
1 826
|
+ 312%
|
| Number of total screens |
1 763
|
3 248
|
+ 84%
|
| Total admissions in the country |
98 045 238
|
155 910 781
|
+ 59%
|
| |
1995
|
2001
|
Var % 01/95
|
| NL |
Number of screens in multiplexes |
17
|
70
|
+ 312%
|
| Number of total screens |
487
|
565
|
+ 16%
|
| Total admissions in the country |
17 183 515
|
23 787 086
|
+ 38%
|
Tab. 11: THE EVOLUTION OF ADMISSIONS, SCREENS
AND SCREENS IN MULTIPLEXES
(Central and Eastern Europe)
| |
1995
|
2001
|
Var % 01/95
|
| CZ |
Number of screens in multiplexes |
8
|
75
|
+838%
|
| Number of total screens |
817
|
749
|
-8%
|
| Total admissions in the country |
9 253 214
|
10 363 300
|
+12%
|
| |
1996
|
2001
|
Var % 01/96
|
| HU |
Number of screens in multiplexes |
9
|
110
|
+ 1 122%
|
| Number of total screens |
550
|
622
|
+ 13%
|
| Total admissions in the country |
13 279 000
|
15 693 000
|
+ 18%
|
| |
1998
|
2001
|
Var % 01/98
|
| PL |
Number of screens in multiplexes |
8
|
187
|
+ 2 238%
|
| Number of total screens |
714
|
852
|
+ 19%
|
| Total admissions in the country |
20 317 746
|
27 649 652
|
+ 36%
|
Several studies (some of which are also reported
by MEDIA Salles in the newsletter European Cinema Journal or in the
Cinema Research Library) show, however, that the establishment of multiplexes
is only one of the elements that influence the increase in admissions.
In fact, the films on offer are also important in determining variations
in admissions.
1998, for example, which recorded very high admissions throughout almost
the whole of Europe, with the important exception of Great Britain,
was characterised by the enormous success of Titanic.
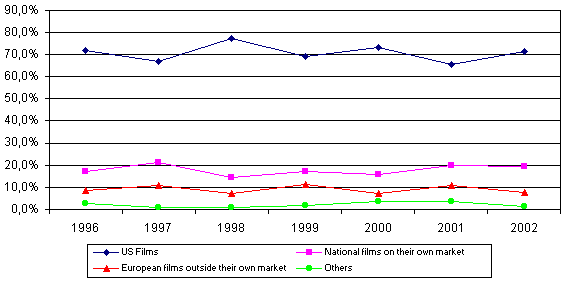
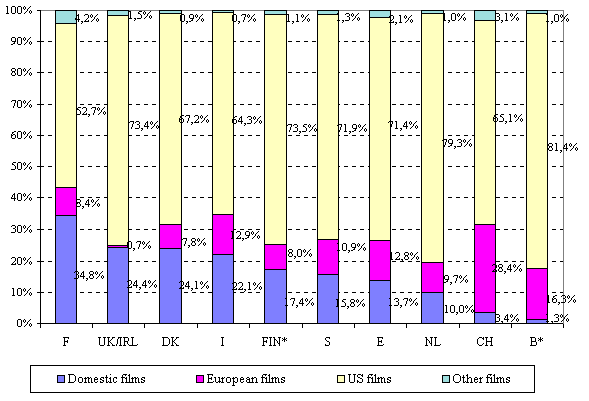
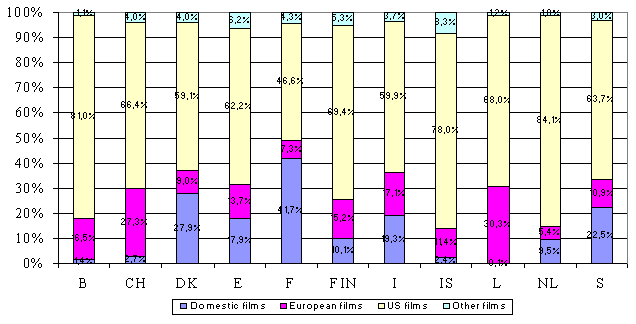
Whilst I refer you to the following tables in order to gain an idea
of how many films of what nationality were seen in Europe, I should
like to make an observation regarding domestic films.
Tab. 12: BREAKDOWN OF ADMISSIONS IN THE EUROPEAN
UNION BY FILM ORIGIN
| |
1996
|
1997
|
1998
|
1999
|
2000
|
2001
|
2002
|
| US Films |
71,6%
|
67,0%
|
77,5%
|
69,2%
|
73,3%
|
65,4%
|
71,2%
|
| National films on their own market |
17,1%
|
21,3%
|
14,4%
|
17,5%
|
15,7%
|
20,1%
|
19,5%
|
| European films outside their own market |
8,8%
|
10,7%
|
7,1%
|
11,3%
|
7,2%
|
11,0%
|
7,9%
|
| Others |
2,6%
|
1,1%
|
1,1%
|
2,0%
|
3,8%
|
3,5%
|
1,3%
|
Source: European Audiovisual Observatory, European cinema attendances
stagnates as local films fail to travel,
Press release, Strasbourg, 4 May 2003, www.obs.coe.int
(2002: provisional data).
Tab. 13: MARKET SHARES BY FILM ORIGIN IN
WESTERN EUROPE - 2002
Tab. 14: MARKET SHARES BY FILM ORIGIN IN WESTERN EUROPE - 2001
* New releases only.
Tab. 15: MARKET SHARES BY FILM ORIGIN IN
CENTRAL AND EASTERN EUROPE - 2002
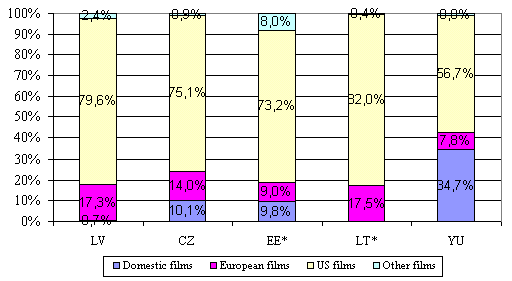
* New releases only.
Tab. 16: MARKET SHARES BY FILM ORIGIN IN
CENTRAL AND EASTERN EUROPE AND MEDITERRANEAN RIM - 2001
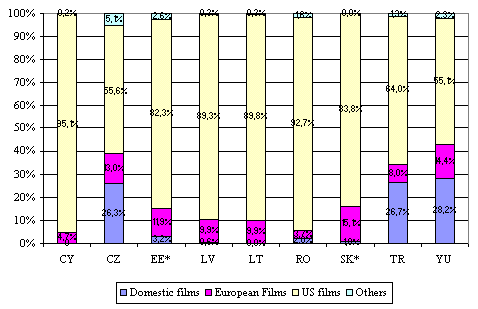
* New releases only. TR: percentage on admissions.
Tab. 17: MARKET SHARES OF DOMESTIC MOVIES
| |
2001
|
2002
|
|
admissions
|
|
|
var% 02/01
|
| B* |
1,4%
|
1,3%
|
|
+ 2,3%
|
| CH |
2,7%
|
3,4%
|
|
+ 9,9%
|
| DK |
27,9%
|
24,1%
|
|
+ 8,3%
|
| E |
17,9%
|
13,7%
|
|
- 4,2%
|
| F |
41,7%
|
34,8%
|
|
- 0,7%
|
| FIN* |
10,1%
|
17,4%
|
|
+ 17,8%
|
| I |
19,3%
|
22,1%
|
|
+ 2,7%
|
| N |
15,2%
|
7,5%
|
|
- 3,5%
|
| NL |
9,5%
|
10,0%
|
|
+ 1,4%
|
| S |
22,5%
|
15,8%
|
|
+ 1,1%
|
| CZ |
10,4%
|
10,1%
|
|
+ 3,2%
|
| EE* |
3,2%
|
9,8%
|
|
+ 19,5%
|
| HU |
5,1%
|
7,8%
|
|
-5,80%
|
| LV |
0,6%
|
0,7%
|
|
- 7,1%
|
| PL |
41,8%
|
22,4%
|
|
- 2,0%
|
| YU |
28,2%
|
34,7%
|
|
- 0,8%
|
HU, PL: percentages on admissions.
In some territories the presence of domestic
films with wide appeal is very important and apparently manages to attract
extra audiences into the cinemas.
As an example we can look at what happened in 2001 on markets such as
Germany, Norway and Poland.
Tab. 18: GERMANY
|
Total admissions in
2001:
178 m. (+16,6%)
|
|
From TOP 10 FILMS (by admissions):
1. Der Schuh des Manitu (DOM.):
10,5 m.
(5,9% of total admissions)
2. Harry Potter and the Sorcerer's
Stone
10,4 m.
|
Tab. 19: NORWAY
|
Total admissions in
2001:
12,5 m. (+7,7%)
|
| From TOP 10 FILMS (by admissions): |
| 1. Elling (DOM.) |
770 000 |
| 2. Harry Potter and the Sorcerer's
Stone |
687 000 |
| 3. Bridget Jones' Diary |
579 000 |
| 4. Cool and Crazy (DOM.) |
556 000 |
|
% of top 2 DOM on total admissions: 10,6
|
|
Tab. 20: POLAND
|
Total admissions in
2001:
27,6 m. (+ 32,3%)
|
| From TOP 10 FILMS (by admissions): |
| 1. Quo vadis (DOM.) |
4 276 674 |
| 2. W pustyni i w puszczy (DOM.)
|
2 221 137 |
| 3. Przedwionie (DOM.) |
1 742 587 |
| 7. Wiedzmin (DOM.) |
606 288 |
|
% of top 4 DOM on total admissions: 32%
|
|
Lying behind the decidedly significant
increases in admissions compared to the previous year, is certainly
the success of domestic films, such as, in Germany, "Der Schuh des Manitu"
( 10,5 million tickets sold, equal to 5,9% of the total), in Norway
"Elling" and "Cool and Crazy" (1,3 million tickets sold, equal to 10,6%
of the total) and in Poland "Quo vadis", "W pustyni I pusczy", "Przedwiosnie"
and "Wiedzmin" (8,8 million tickets sold, equal to 32% of the total).
Unfortunately, what paralyses domestic
films is the irregularity with which box-office successes are released.
This irregularity also regards non-domestic European films. In some
years very few titles are sufficient to attract large audiences; as
an example, we can quote Spain in 1999, where a handful of titles, including
"La vita è bella", "Notting Hill", "Astérix et Obélix contre César",
managed to sell a total of around 22 million tickets out of an impressive
25,2 million for non-domestic European films.
Tab. 21: SPAIN
|
Total admissions of European films
in 1999:
25,2 m.
(19,3% of total admissions)
|
Top European Films - 1999
| Title |
Year
released
|
Nationality
|
Distributor
|
Admissions
|
Gross Box Office
|
Prints
|
|
LA VITA È BELLA
|
1999
|
I
|
Lauren Films
|
4 145 559
|
2 582 956 371
|
209
|
|
NOTTING HILL
|
1999
|
UK, USA
|
Warner Sogefilms
|
3 354 932
|
2 065 342 924
|
254
|
|
SHAKESPEARE IN LOVE
|
1999
|
UK, USA
|
UIP
|
2 870 252
|
1 807 374 719
|
210
|
|
ENTRAPMENT
|
1999
|
UK, D, USA
|
Hispano Fox Films
|
2 637 701
|
1 638 763 995
|
253
|
|
ASTÉRIX ET OBÉLIX CONTRE CÉSAR
|
1999
|
F, D, I
|
Columbia Tristar
|
2 132 801
|
1 399 077 088
|
265
|
|
THE WORLD IS NOT ENOUGH
|
1999
|
UK, USA
|
UIP
|
1 414 889
|
969 023 776
|
240
|
|
EYES WIDE SHUT
|
1999
|
UK, USA
|
Warner Sogefilms
|
1 405 992
|
910 642 160
|
255
|
|
LE DÎNER DE CONS
|
1999
|
F
|
Sherlock Media S. L.
|
627 505
|
418 345 236
|
66
|
|
EVER AFTER: A CINDERELLA STORY
|
1998
|
UK
|
Hispano Fox Films
|
599 173
|
356 382 633
|
216
|
In conclusion, what emerges from the figures
is the necessity of taking into account several factors, of which we
have provided some examples, in analysing increases in admissions.
|

