1.1
Number of screens
The current situation
The exhibition sector in the 12 EU country comprised 16,621 screens
in 1992. The 12 EU countries, with a population of 347 million, therefore
had at their disposal less than two-thirds of the number of screens in
the US: there are some 24,233 screens in the US serving a population of
249 million. These figures represent one screen per 20,900 head of population
of Europe, against one screen per 9,900 in the United States, which illustrates
the substantial decline in the installed base in Europe in the last twenty
years.
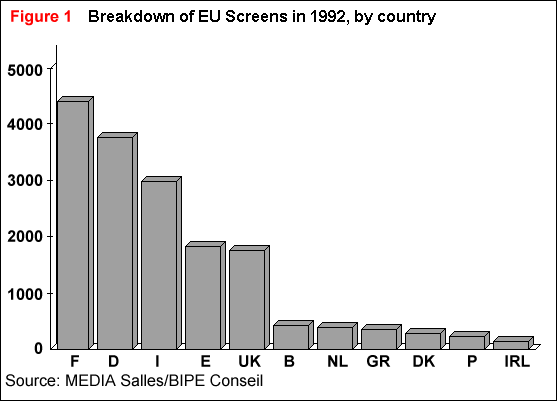
Obviously, there is considerable variation in capacity between the
different countries. The average number of screens per EU country is 1,509
(see Figure 1 and Table 1).
France and Germany have the largest number of screens, and between them
account for nearly 50% of the total number. At the other extreme, the total
capacity of Belgium, the Netherlands, Greece, Denmark, Portugal and Ireland
added together accounts for about 12% of European screens - as compared
with nearly 16% of the population.
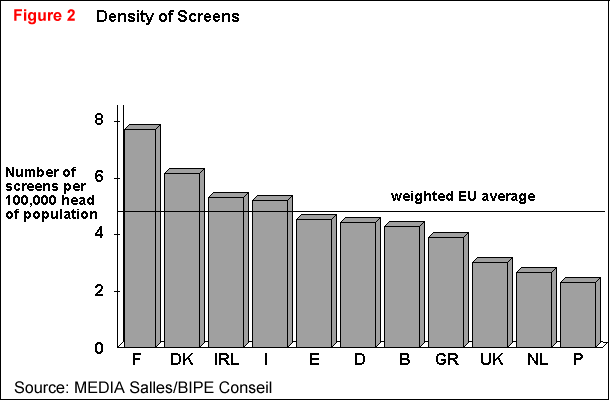
For the purpose of international comparison, however, density (number
of screens per 100,000 population) is probably a more significant indicator
than absolute values - See Figure 2 and Table
2. This indicator varies considerably - by a ratio of 1:4 - in the
twelve EU countries: there are a little more than two screens per 100,000
head of population in Portugal, compared with 7.7 screens in France. France
has at its disposal two and a half times the number of screens that the
UK has, even though the two countries have comparable populations and admissions
levels. We will see that the reason for this variation lies with the provision
of cinemas in communities with less than 20,000 population. But even with
its level of cinema provision, France is still short of the US population-per-screen.
Amongst the many factors which explain these differences, two are probably
particularly important:
· the differences in the number of
visits per year per head of population, which are themselves influenced
by numerous factors: some environmental, like population shifts, the development
of alternative methods of viewing feature films, films on offer, means
of film promotion, the social function of cinema-going, the amount of competition,
etc; others appertaining to better management of cinemas by exhibitors:
modernisation of screens, ticket prices, how well the cinemas present themselves
and the quality of ancillary services provided (e.g. refreshments, parking,
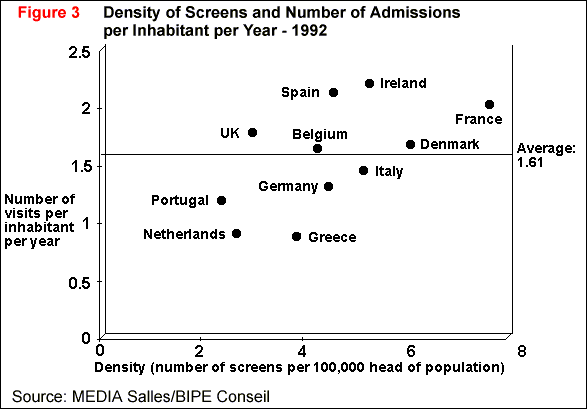
and programming). The close relationship of these supply indicators with
the frequency of cinema-going (Figure 3) shows that, with two exceptions,
the group of countries with the highest density of installed sites is broadly
the same as the group with the highest number of visits per year per inhabitant;
on the other hand, the countries which have a lower density of sites have
much lower levels of cinema-going. Two countries do not conform to this
tendency: they are at the two extremes - the UK, where sites are high-yield,
and France, which where the inverse applies, and the industry is relatively
over-supplied with cinemas. It should be noted that there exists a strong
correlation between the density of population and the density of screens
in the EU (greater than 0.85). This explains why the Netherlands, in particular,
have one of the lowest screen densities in Europe.

|
Table 1 Installed base by country, 1992
|
|
Country
|
Number of screens, 1992
|
% of screens per country
|
| Belgium |
431
|
2.6
|
| Denmark |
315
|
1.9
|
| France |
4,402
|
26.5
|
| Germany |
3,630
|
22.0
|
| Greece |
405
|
2.4
|
| Ireland |
189
|
1.1
|
| Italy |
3,020
|
18.1
|
| Netherlands |
416
|
2.5
|
| Portugal |
232
|
1.4
|
| Spain |
1,807
|
10.8
|
| UK |
1,757
|
10.6
|
| Total |
16,604 (1)
|
100.0
|
(1) Total cinemas in EU, including Luxembourg:
16,621
Source: MEDIA Salles |

|
Table 2: Density of installed base, 1992
|
| Country |
Number of screens per 100,000 head of population
|
| Belgium |
4.3
|
| Denmark |
6.1
|
| France |
7.7
|
| Germany (1) |
4.5
|
| Greece |
3.9
|
| Ireland |
5.3
|
| Italy |
5.2
|
| Netherlands |
2.7
|
| Portugal |
2.4
|
| Spain |
4.6
|
| UK |
3.0
|
| European Average |
4.8
|
(1) 5.2 for West Germany only
Source: MEDIA Salles/BIPE Conseil |
· public intervention to
help maintain cinemas in areas of low-density population. These political
subsidies are provided either by national or local government agencies.
The State intervenes by offering aids to investment, help with running
costs and subsidies for additional prints in France, Germany and Denmark.
To be precise, the total aid in the case of France - or more accurately
the re-distribution of box office receipts - represents on average more
than 5% of exhibitors' revenues. Lower-tier public authorities (regional
and local government) apply their efforts to providing premises for exhibitors
and giving them grants.
These different factors give us a map of the European Union
with stark contrasts in terms of screen density. Obviously they have repercussions
on public perceptions, and on the public's use of cinemas: either as a
local service to enliven even the smallest communities, or as an urban
leisure pursuit, generally limited to the big population centres.
Trends
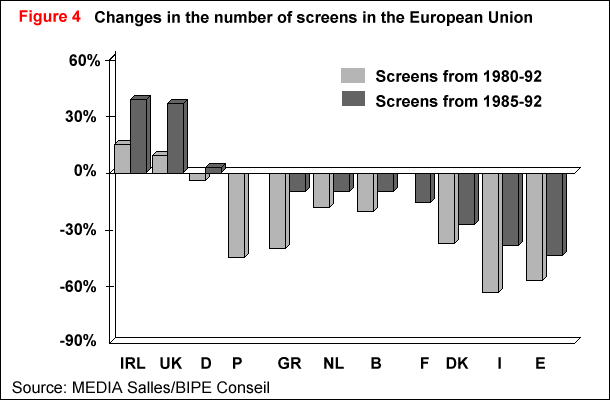
Taking both these models into account, exhibition throughout the EU
has experienced the same drastic reduction in capacity: in 32 years, the
EU exhibition industry has lost over 40% of its screens (see Table
3). By contrast, the US has experienced continuous growth since the
beginning of the 1970s - with a growth rate of nearly 300% in 20 years.
Dwindling European capacity is linked to falling attendance, which we shall
see has been particularly marked over the period. The situation seemed
to be improving in the mid 1980s: from 1985-1992, there was a net decrease
(closures minus openings) in the number of screens of only 9%; this contrasts
with 18% in the previous five years.
Several factors combine to explain the slowing down in the rate of
cinema closures in the last five years: the opening of multiplexes, with
8 screens or more, has had a positive effect on capacity in several countries,
particularly in outer-cities (the UK, Ireland and Belgium). In many cases,
the advent of the multiplex has been accompanied by a resurgence of cinema-going
in the cinema's catchment area, which in turn has given the older establishments
an incentive to modernise, and, in certain cases, to increase their capacity.
This is particularly the case in the UK.


