1.2
Numbers of admissions
Total number of admissions
In 1992, the total number of admissions in EU cinemas was around 560
million. Numbers of admissions vary less than the number of screens from
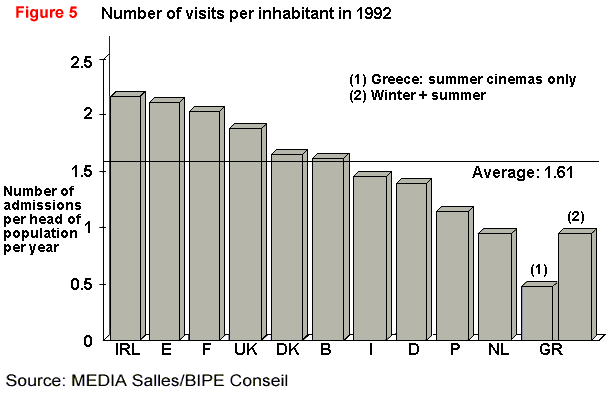
one country to another. In Greece, people certainly go less often to the
cinema than they do in Ireland, but the difference is only moderate: Greeks
go about once a year while the Irish go a little less than two-and-a-half
times a year (see Figure 5), and the weighted average
is a little more than one and a half times-a-year. This is substantially
less, however, than in the US, where people go to the cinema on average
almost four times a year (964 million admissions for 249 million people),
and this in a market where VCRs are in 75% of homes.
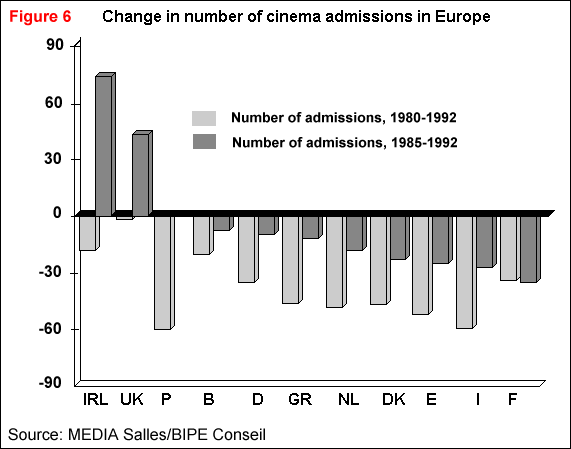
Looking at the average, the fall in number of admissions is now stabilising:
the average number of admissions in the whole of the EU has only dropped
4% in the last five years, whereas from 1980 to 1992, it fell overall by
38%. But this convergence towards two visits-a-year per inhabitant is the
result of greatly contrasting shifts in demand: countries are clearly divided
into two groups, as Figure 6 and Table
3 show:
· the countries which have demonstrated
an increase in numbers of visits, or a slowing down in the fall in numbers
of visits. In the case of both the UK and Ireland, the overall trend
is one of increase. In Belgium and Germany it is more accurate to talk
of a slowing down in the fall, and the explanatory factors are different:
without doubt, in Germany and Belgium admissions have reached their nadir;
the rapid development of multiplexes has halted the fall in numbers of
admissions.
· the countries in which one
observes, in contrast, a continued fall in the number of admissions: Italy
and Spain. In Italy, notwithstanding sizable investments in the sector,
multiplexes have not yet developed; Spain has suffered from an inadequate
level of modernisation in the last five years. France is a case apart:
it has seen a fall of 5% in total admissions in the last five years. Everything
indicates that there is a time lag between changes in France and those
in other European countries. In fact, during the 1970s, the number of admissions
was saved from falling by the creation of multi-screens and by the maintenance
of national film production, then, during the 1980s, admission levels suffered
from the increased prevalence of satellite television and feature films
being available on video, and the maintenance of the sector is now mainly
due to the involvement by the public authorities in the running of the
less-favoured parts of the sector. However, in several countries (France,
Netherlands), the year 1993 saw a significant increase in the number of
admissions.


|
Table 3: Changes in numbers of admissions and screens since 1960,
by country.
|
| |
No. of admissions 1960-1992
|
No. of admissions
1980-1992
|
No. of admissions, 1985-1992
|
No. of screens
1960-1992
|
No. of screens, 1980-1992
|
No. of screens, 1985-1992
|
| Belgium |
-79%
|
-20%
|
-7%
|
-74%
|
-22%
|
-11%
|
| Denmark |
-80%
|
-46%
|
-23%
|
-31%
|
-33%
|
-26%
|
| France |
-67%
|
-34%
|
-34%
|
-23%
|
-2%
|
-14%
|
| Germany (1) |
-85%
|
-35%
|
-10%
|
-53%
|
-5%
|
5%
|
| Greece |
-96%
|
-45%
|
-12%
|
|
-42%
|
-10%
|
| Ireland |
-81%
|
-17%
|
74%
|
-31%
|
16%
|
40%
|
| Italy |
|
-64%
|
-28%
|
|
-64%
|
-38%
|
| Netherlands |
-74%
|
-47%
|
-10%
|
-24%
|
-18%
|
-10%
|
| Portugal |
|
-60%
|
|
|
-47%
|
-29%
|
| Spain |
|
-52%
|
-24%
|
|
-56%
|
-42%
|
| UK |
-79%
|
0%
|
44%
|
-42%
|
10%
|
38%
|
| Average (2) |
-80%
|
-38%
|
-3%
|
-40%
|
-24%
|
-9%
|
(1) Excluding East Germany
(2)Unweighted average
Source: MEDIA Salles/BIPE Conseil |
Rate of capacity utilisation: average admissions per
seat
In order to gain a picture of what is happening to the provision of
screens and to admissions, comparisons can be made for capacity utilisation,
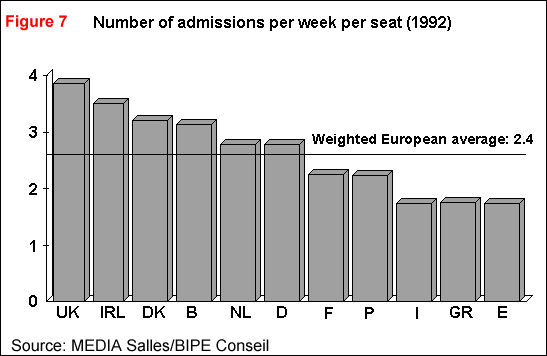
expressed in terms of the number of admissions per seat, which show that,
here as well, there is a considerable diversity in exhibitors' fortunes
in different parts of the European Union (see Figure
7 and Table 4). The rate of admissions-per-seat
varies at the two extremes from 3.8 per week in the UK to 1.79 per week
in Greece, which is a ratio of 2.1:1. This of course points to the wide
diversity in relative profitability of the exhibition industry in the different
countries of the European Union.
Contrary to all expectations, a few larger countries have capacity
utilisation rates which are lower than the European average:
· Germany and France, where, as
we have emphasized, part of the sector owes its survival to an active policy
of subsidising the exhibition industry, and regional development by local
or national governments. Even where the sector has been modernised, as
in France during the 1970s with the creation of multi-screen cinemas, and
in Germany more recently with the creation of multiplexes, the sector still
includes cinemas which have a very low number of admissions. It is worth
noting that although a screen in Paris might attract on average 80,000
spectators a year, a screen in a town with a population of 200,000 and
over will only attract 47,000 spectators on average, and a screen in a
rural area (with a population of less than 20,000) will operate with an
average of 10,000 admissions. Capacity utilisation rates in France suffer,
therefore, from the high screen density.
The four southern European countries have relatively similar rates of capacity
utilisation:
· Portugal, which has the highest
rate (because of the recent closure of numerous cinemas which has not translated
into a fall in admissions).
· Spain, which paradoxically has
an important exhibition sector, and a relatively high number of annual
admissions per head of population, but whose capacity utilisation rate
is one of the lowest in the EU, is characterised by a large number of screens
with large seating capacity. The average number of seats per screen was
498 in 1992, compared to 221 in France and 200 in Germany.
· Italy and Greece, where the single
screen cinemas represent the large majority.
Conversely, as we shall see, Ireland, the UK and Belgium illustrate the
favourable impact which multiplexes with more than 8 screens have exerted
on admission rates in the densely populated areas (complexes with 10 -
15 screens in highly-populated urban areas, and, outside the main cities,
increased advertising of film releases, with its favourable impact on total
admissions, and its knock-on effect encouraging the modernisation of other
cinemas, etc.). The Kinepolis complex in Brussels has one of the best capacity
utilisation rates in Europe, with eight admissions per week per seat. Denmark's
position is also worth mentioning, and seems to be based on cinemas being
confined to the big population centres.

|
Table 4: Number of admissions
and capacity utilisation rate (weekly admissions per seat in 1992), by
country
|
|
Country
|
Number of seats (1992)
('000)
|
Number of admissions per year (Millions)
|
Number of admissions per week per seat
|
| Belgium |
101
|
16.5
|
3.1
|
| Denmark |
52
|
8.6
|
3.2
|
| France |
972
|
115.9
|
2.3
|
| Germany |
725
|
105.9
|
2.8
|
| Greece |
100
|
9.3
|
1.8
|
| Ireland |
43
|
7.9
|
3.5
|
| Italy |
902
|
83.6
|
1.8
|
| Netherlands |
95
|
13.7
|
2.8
|
| Portugal |
96
|
11.8
|
2.3
|
| Spain |
900
|
83.3
|
1.8
|
| UK |
520
|
103.6
|
3.8
|
| Total |
4,506 (1)
|
560.1 (1)
|
|
| Average(2) |
|
|
2.4
|
(1) Total number of seats, including
Luxembourg: 4,509
Total number of admissions, including Luxembourg:
560.7
(2) Weighted Average
Source: MEDIA Salles/BIPE Conseil |
These factors are confirmed by the quantitative survey,
which places the average admission rate per seat per week at around 3,
which is an average occupancy rate of about 15% per seat (see Table
5).
Conclusions
On the basis of these two criteria - density of screens and capacity
utilisation - it is possible at a macroscopic level to classify countries
into four groups:
Weighted average: 5.24 cinemas/100,000 head
of population
|
1992
|
Density greater than the EU average
|
Density less than or equal to the EU average
|
Weighted average: 2.40 weekly
admissions/seat |
| Admissions rate greater than European average |
Ireland
Denmark
|
UK
Belgium
The Netherlands
|
| Admissions rate less than or equal to the European average |
Italy
France
West Germany
|
Portugal
Greece
Germany (E & W)
Spain
|
Two main typologies of the cinema exhibition industry
in the European Union suggest themselves:
· the intensive typology,
represented by the UK, Belgium and the Netherlands, where the recovery
of the sector has been in response to market forces of the last twenty
years, accompanied by an active policy of modernisation, which has caused
the admissions rates of cinemas to rise.
· an extensive typology,
represented by Italy, France and (West) Germany, where cinema density is
still high, and capacity utilisation rates are comparatively and relatively
low. These countries are characterised by the continuance of cinemas serving
small populations, sustained by local or national government, because cinema
in the wider sense, including film production, is seen as a vital part
of the national identity. The cinema here is often still seen as the central
point of the film industry. It is worth emphasizing the relatively weak
role of circuits in several of these countries.
Is European film going to be swallowed without trace by the
liberal model proposed by the US majors, which can be seen particularly
in Britain? We hope to bring together factors which answer that question
in the last chapter.
|
Table 5: Distribution
of EU screens by capacity utilisation per week (1992)
|
| Less than one admission per seat |
34.7%
|
| 1 to 2.99 admissions per seat |
31.3%
|
| 3 to 4.99 admissions per seat |
14.9%
|
| 5 to 9.99 admissions per seat |
12.0%
|
| More than 10 admissions per seat |
7.1%
|
| Source: MEDIA Salles/BIPE Conseil |


