1.3 Geographical distribution and data on screens
 
Screen provision by population area
 
The relative depopulation of the countryside, the fall in the number of admissions and the mounting costs of exhibition create increasing problems in ensuring the profitability of cinemas in areas of low population. The last ten years have therefore been marked by closures of cinemas situated in areas where the number of potential spectators is no longer sufficient to cover a cinema's running costs; the number of closures varies from country to country.
 
By contrast, the shift of multiplexes (8 screens or more) to the outskirts of the major towns has impelled a trend in the opposite direction: some of the new cinemas have located at the edge of population centres, often in smaller communities, which statistically inflates the contribution of middle-sized population areas, even where they form part of the catchment areas of large conurbations.
 
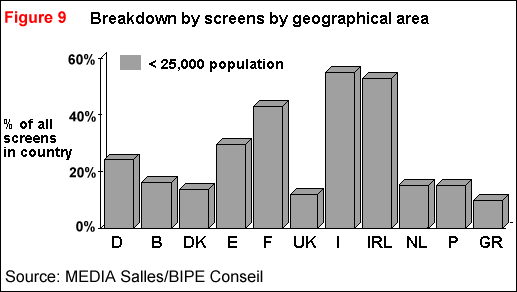
Although countries like France, Germany and the Netherlands have a relatively even spread of cinemas (in France, for example, cinemas located in towns with populations under 20,000 represent 40% of the sector, although these account for 20% of the population), in many other countries there is a concentration of cinemas in the main cities, with populations generally above 250,000. This is the case for Portugal, where cinemas are mostly concentrated in Lisbon and Oporto; for Denmark, where exhibition is concentrated in Copenhagen, Odense, Aarhus, Alborg and Horsen. It is even true of Belgium, where less than 15% of screens serve 20,000 head of population or less, and of Greece, where 68% of screens are located in Athens.
 
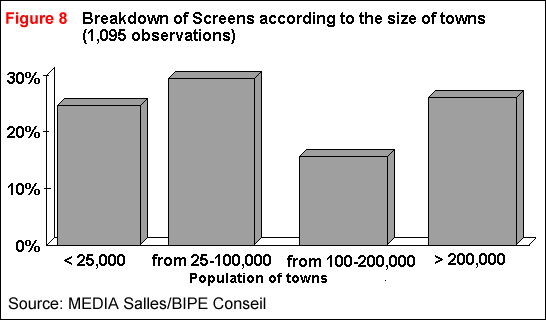
In seven out of the twelve countries, the shift of screens to the densely populated areas is very clear. In several countries, the capital compares strongly with elsewhere, accounting for 35-50% of the number of screens (particularly Greece, Portugal, Denmark and Belgium). It is only in countries where the economy is decentralised (like Germany and the Netherlands) or where public authorities have adopted an altruistic policy of maintaining the sector in the rural areas (like in France) that the geographical distribution is different (see Figures No 8 and 9).
 
The information gathered about admission rates and the generally-observed trend of small communities and rural areas losing their screens, would suggest that this movement will continue in the next ten years, unless the authorities choose to intervene.
 
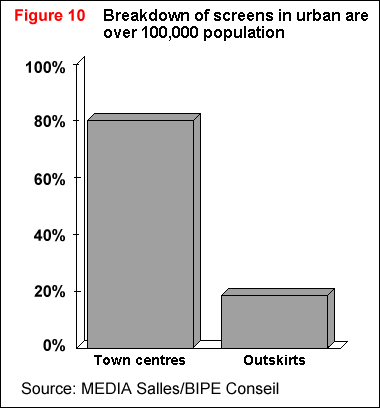
The other interesting issue thrown up by the study is the location of screens within the big cities. By and large, all the screens in the big cities are in the city centre (80% of them); even the weight of the multiplexes with more than 8 screens is not sufficient to compensate for this traditional dominance of town-centre cinemas (see Figure 10).
 
The survey also showed that the majority of single-screen cinemas have catchment areas of less than 100,000 (see Table 6). At the other extreme, every multiplex with more than 8 screens has a catchment area of more than 250,000 population. In countries where there are few large conurbations, the potential for development of multiplexes with more than eight screens is limited: this is the case in Ireland (no city, with the exception of Dublin, has a population of 250,000 or more), and in Greece and Portugal (with two urban areas each with over 250,000 population). If one accepts that the multiplexes are the most dynamic component of the exhibition industry, it follows that these countries will face an increasing geographical concentration of screens in particular areas; for the rest of the country, an increasing "desertification" is likely.


Analysis of admissions by geographical area
 
Numerous indicators show how, as one might expect, the larger the catchment area (in terms of population), the healthier the exhibition sector (in terms of number of screens per cinema, modernisation, capacity utilisation, number of weeks of opening, etc.). However, the capacity utilisation rates vary considerably for cinemas situated in areas with more than 100,000 head of population: the quantitative survey showed that they ranged between 3.4 and 5.8 admissions per seat per week (see Table 7).
 
In the course of the analysis, it also became evident that the type of area was just as important in determining the nature of programming for the cinemas: it was the middle-sized towns which suffered most from a lack of programming variety (in terms of the numbers of films per cinema and the nationality of films). The cinemas situated in the less-populated areas were those which showed the greatest number of national films, including a selection of experimental and art-house films, probably as a result of government intervention, as the small towns have municipal cinemas.
 
  
 Table 6: Distribution of types of screen, in relation to the population of area served
Population:
0-100,000 
100-250,000 
250,000-1 million 
more than 1 million 
Single screen cinemas
52.3%
13.3%
8.4%
26.0%
2 screens
54.1%
13.6%
10.3%
22.0%
3 - 5 screens
46.5%
26.6%
13.1%
13.7%
6 - 7 screens
11.2%
45.5%
16.4%
26.9%
More than 8 screens
0.%
5.3%
53.3%
41.4%
Source: MEDIA Salles/BIPE Conseil


 Table 7: Rate of seat occupancy in relation to the population of area served (Number of admissions per seat per week)
Population:
Less than 25,000
25,000 to 50,000
50,000 to 100,000 
100,000 to 250,000
250,000 to 1 million 
More than 1 million
Overall Average
(Average) number of admissions per seat per week
 
1.81
 
1.88
 
1.84
 
3.40
 
5.77
 
4.09
 
2.42
Source: MEDIA Salles/BIPE Conseil