Milan, 10 February 2016
PRESS RELEASE
In 2015 more spectators (+5.2%) in Europe's cinemas, while digitization reaches 95% of screens
An anticipation of the data MEDIA Salles brings to the Berlinale
From the statistics elaborated by MEDIA Salles it emerges that in the 32 countries for which figures are already available, from Iceland to Cyprus, from Russia to Portugal, there were 1,210.5 million spectators, with a 5.2% rise compared to the 1,151.0 million of 2014.
"2015 was a good year for European cinemas. The increases in admissions and box-office concerned practically all the countries analysed by MEDIA Salles, unlike those years in which - as in 2014 - a generally positive result for Europe concealed marked differences, with some countries recording growth and other territories dips, even considerable ones," comments Paolo Protti, President of MEDIA Salles.
The 18 countries in Western Europe - with a total of 866.0 million admissions compared to the 816.5 in 2014 - record a 6.1% increase, whilst the 14 in Central and Eastern Europe and the Mediterranean Rim close the year with a 3.0% rise and a total of 344.5 million tickets sold compared to the 334.5 million in 2014. It is the tenth consecutive year of growth in this part of Europe, which has made it possible to more or less double the numbers of spectators in one decade.
Western Europe
Exceptional increases in ticket sales are to be seen in Portugal (20.4%), in Finland (20.3%) and Denmark (15.8%).
The main reason behind the exceptional increase in spectators in Finland is the excellent result not only of Hollywood films, but also of Finnish titles themselves. The latter sold 2.6 million tickets (29.5% of the overall total) bettering the record 2012 (2.4 million tickets) and thus obtaining the best results since 1970.
The leading 5 markets also record a particularly positive result: that of Germany where, according to FFA-published data, there were 139.2 million spectators, a growth rate of 14.3% over 2014. Thanks to this leap forward, Germany regains a figure that had not been attained since 2009.
The growth rate is also above average in the United Kingdom (9.2%). One of the reasons for this result (over 14 million more spectators than the previous year) is the success of "homemade" films like Second Best Exotic Marigold Hotel, Suffragette, Spectre - the latest 007 - and The Lady in the Van. And although Star Wars cannot officially be considered of UK nationality, its "British" side (it was shot in the legendary Pinewood Studios like the 007 series) resulted in the "force being in the number of tickets sold in the United Kingdom", as emphasized by Mike Vickers, one of the most renowned independent programmers in the Country.
In Italy, the estimates elaborated by MEDIA Salles point to a 10.1% increase in box office and an 8.1% increase in admissions, with a total of 104.5 million tickets sold for screens operating at least 60 days a year. Spain, which grows by 1.2%, or below the average, nonetheless obtains its second consecutive rise after the series of negative results that had begun in 2005.
On the leading 5 Western European markets, a counter-trend is to be seen in France, which loses 1.4% of its spectators, whilst still establishing itself as the most important market in Europe, keeping well above the 200 million threshold. What weighed on these figures was the drop in the number of spectators for domestic films, compared to a truly exceptional 2014.
The Dutch market remains basically stable (-0,2%), with between 30 and 31 million spectators ever since 2011, as does Liechtenstein, which confirms its 19 thousand spectators.
Positive signs also come from Denmark (+15.8%), Luxemburg (+15%), Switzerland (+11.3%), Greece (+9.3%) and Norway (+8.6%), all countries with an above-average growth rate for Western Europe.
Less evident growth is recorded in Ireland (+5.6%), Austria (+4.9%), Sweden (+4.6%) and Iceland (+2.8%).
Although official overall figures are not yet available, the estimate for Belgium foresees a rise. It can already be stated that Flemish films gained positive results in terms of audiences in 2015.
Central and Eastern Europe and the Mediterranean Rim
If the overall situation in Central and Eastern Europe and the Mediterranean Rim is positive, two slight dips are noted on the two biggest markets in terms of numbers: Russia (-0.2%) and Turkey (-1.5%). These are nevertheless countries that have seen the highest growth rate in terms of spectators in the whole continent over the past few years. Moreover, despite the slight dips in admissions, the box-office recorded both in Russia and in Turkey - when calculated in the national currencies - proves to have grown by respectively 1.9% and 4%.
In terms of increases in admissions, exceptional results are recorded in Estonia (19.0%), Romania (18.0%) and Hungary (18.3%). In the latter country the 2015 success is also due to cinema "made in Hungary", and thanks in particular to the film Saul Fia (Son of Saul) which, after the award at Cannes and the nomination to the Oscars, affirmed itself mainly on the art-house circuits.
Above-average growth rates are also to be seen in the Czech Republic (12.1%), Slovakia (11.4%), Poland (10.7%), Bulgaria (6.9%), Slovenia (6.3%), Cyprus (5.9%) and Croatia (3.9%).
More limited growth was to be found in Lithuania (3.0%) and Latvia (2.0%).
Digitization nears completion: the data as at 1 January 2016
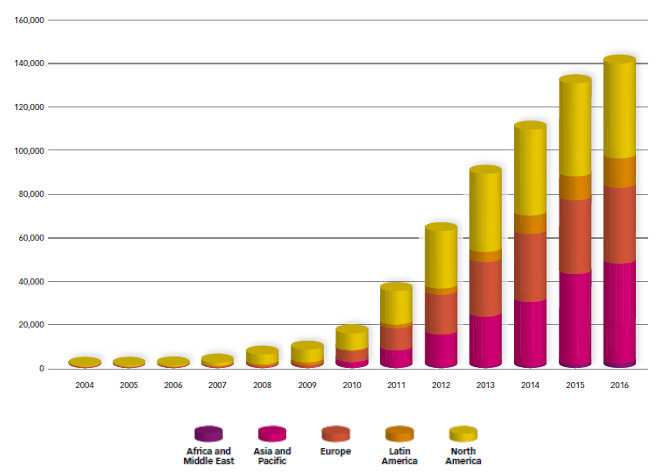
During the course of 2015 the number of digital screens continued to rise: the first statistics available show that Europe starts 2016 with 36,200 digital projectors, around 95% of the total, with a 6% increase over 1 January 2015.
In 2015, over the twelve-month period, a clear acceleration in the rate of conversion to the new technology was to be found in some of the (now few) countries that have not yet digitized all their screens. This is the case, for example, of a large market such as Turkey, where the rate of digitization rose from 55% to over 80%, with a particularly significant rise in the first half of 2015. A similar increase to also to be seen on a smaller market, like Latvia, where it grew from 69% to over 90%. Estonia, too, recorded considerable growth: digital screens, which represented 49% of the total at the start of 2015, now touch on 70%. This level has now also been reached by Greece, where digital projectors had been installed on 46% of screens at the beginning of 2015.
Amongst the Continent's six largest markets Russia (approx. 99.9%), closely followed by Italy (approx. 97%) and Spain (approx. 92%), is now aligned with France, the United Kingdom and Germany, which already boasted almost 100% digitization.
To sum up, with its 36,200 digital screens, Europe is the third largest world market after North America, which counts around 43,000 digital projectors, and Asia and the Pacific area, which sprang into the lead in 2015, with over 46,000 units.
DIGITAL SCREENS WORLDWIDE AT 1st JANUARY
© copyright MEDIA Salles
CINEMA-GOING IN EUROPE
© copyright MEDIA Salles
Europa Occidentale
Western Europe
Presenze (2010-2015)
Admissions (2010-2015)
(x 1 000)
© copyright MEDIA Salles
Il dato del 2011 si riferisce a 52 settimane dal 30/12/2010 al 29/12/2011 per i seguenti Paesi: Grecia, Paesi Bassi, Regno Unito, Svezia, Svizzera e Liechtenstein.
The 2011 figure refers to 52 weeks from 30/12/2010 to 29/12/2011 for the following countries: Greece, Netherlands, United Kingdom, Sweden, Switzerland and Liechtenstein.
Italy: dati relativi agli schermi operanti per più di 60 giorni l'anno. Le presenze relative al totale degli schermi (esclusi arene e ambulanti) erano 96 448 505 nel 1996; 102 566 523 nel 1997; 118 425 865 nel 1998; 103 483 150 nel 1999; 103 367 832 nel 2000; 109 535 939 nel 2001; 114 805 678 nel 2002; 109 312 788 nel 2003; 115 845 480 nel 2004; 104 689 099 nel 2005; 103 931 247 nel 2006; 115 467 872 nel 2007; 109 857 051 nel 2008; 108 263 184 nel 2009; 120 192 276 nel 2010; 112 119 910 nel 2011; 99 412 919 nel 2012; 105 039 259 nel 2013; 97 657 890 nel 2014.
Relevant to screens with more than 60 days of activity per year. The total admissions relevant to all screens (not including arenas and travelling screens) were 96 448 505 in 1996; 102 566 523 in 1997; 118 425 865 in 1998; 103 483 150 in 1999; 103 367 832 in 2000; 109 535 939 in 2001; 114 805 678 in 2002; 109 312 788 in 2003; 115 845 480 in 2004; 104 689 099 in 2005; 103 931 247 in 2006; 115 467 872 in 2007; 109 857 051 in 2008; 108 263 184 in 2009; 120 192 276 in 2010; 112 119 910 in 2011; 99 412 919 in 2012;
105 039 259 in 2013; 97 657 890 in 2014.
Iceland: 1996-2010: fonte Hagstofa Íslands; 2011-2012: fonte SMAIS-The Association of film rights-holder in Iceland; 2013-2015: fonte Icelandic Film Centre.
1996-2010: source Hagstofa Íslands; 2011-2012: source SMAIS-The Association of film rights-holder in Iceland; 2013-2015: source Icelandic Film Centre.
Incasso lordo (2010-2015)
Gross box office revenues (2010-2015)
(EURO x 1 000)
© copyright MEDIA Salles
Italy: dati relativi agli schermi operanti per più di 60 giorni l'anno. L'incasso lordo in milioni di ECU relativo al totale degli schermi del paese (esclusi arene e ambulanti) era 457,2 nel 1996, 495,6 nel 1997 e 587,7 nel 1998.
Nel 1999: 532,9 milioni di EURO. Nel 2000: 544,3 milioni di EURO. Nel 2001: 576,5 milioni di EURO. Nel 2002: 641,6 milioni di EURO. Nel 2003: 610,4 milioni di EURO.
Nel 2004: 658,1 milioni di EURO. Nel 2005: 598,0 milioni di EURO. Nel 2006: 596,6 milioni di EURO. Nel 2007: 660,8 milioni di EURO. Nel 2008: 633,7 milioni di EURO. Nel 2009: 660,1 milioni di EURO. Nel 2010: 771,1 milioni di EURO. Nel 2011: 687,8 milioni di EURO. Nel 2012: 634 milioni di EURO. Nel 2013: 640,4 milioni di EURO. Nel 2014: 597,5 milioni di EURO.
Relevant to screens with more than 60 days of activity per year. The total gross box office in millions of ECU relevant to all screens in the country (not including arenas and travelling screens) was 457,2 in 1996, 495,6 in 1997 and 587,7 in 1998.
In 1999: 532,9 million EURO. In 2000: 544,3 millions of EURO. In 2001: 576,5 millions of EURO. In 2002: 641,6 millions of EURO. In 2003: 610,4 million EURO.
In 2004: 658,1 million EURO. In 2005: 598,0 millions of EURO. In 2006: 596,6 millions of EURO. In 2007: 660,8 millions of EURO. In 2008: 633,7 million EURO. In 2009: 660,1 millions of EURO. In 2010: 771,1 millions of EURO. In 2011: 687,8 millions of EURO. In 2012: 634 millions of EURO. In 2013: 640,4 millions of EURO. In 2014: 597,5 millions of EURO.
Iceland: 1996-2010: fonte Hagstofa Íslands; 2011-2012: fonte SMAIS-The Association of film rights-holder in Iceland; 2013-2015: fonte Icelandic Film Centre.
1996-2010: source Hagstofa Íslands; 2011-2012: source SMAIS-The Association of film rights-holder in Iceland; 2013-2015: source Icelandic Film Centre.
Quote di mercato dei film nazionali (coproduzioni incluse) (2007-2015)
Market shares of domestic films (incl. co-productions) (2007-2015)
© copyright MEDIA Salles
Europa Centrale e Orientale e Bacino del Mediterraneo
Central and Eastern Europe and Mediterranean Rim
Presenze (2010-2015)
Admissions (2010-2015)
(x 1 000)
© copyright MEDIA Salles
Il dato del 2011 si riferisce a 52 settimane dal 30/12/2010 al 29/12/2011 per Polonia e Romania.
The 2011 figure refers to 52 weeks from 30/12/2010 to 29/12/2011 for Poland and Romania.
Russia: Dato riferito al mercato CIS esclusa l'Ucraina stimato come percentuale del mercato CIS complessivo: il 95,6% nel 2008; il 95,2% nel 2009, il 95,9% nel 2010, il 94,7% nel 2011 e il 95,5% nel 2012. 2011-2014: anno solare.
Figure refers to the CSI market, not including Ukraine estimated as a percentage of the overall CIS market: 95,6% of the market in 2008; 95,2% in 2009, 95,9% in 2010; 94,7% in 2011 and 95,5% in 2012. The period over which data was collected regarded 52 weeks, from November one year to November the next. 2011-2014: calendar year.
Turkey: Dal 2011 fonte Antrakt Sinema Gazetesi che rileva i dati su base settimanale.
From 2011 onwards the source is Antrakt Sinema Gazetesi, which collects data on a weekly basis.
Incasso lordo (2010-2015)
Gross box office revenues (2010-2015)
(EURO x 1 000)
© copyright MEDIA Salles
Il dato del 2011 si riferisce a 52 settimane dal 30/12/2010 al 29/12/2011 per Polonia e Romania.
The 2011 figure refers to 52 weeks from 30/12/2010 to 29/12/2011 for Poland and Romania.
Russia: Dato riferito al mercato CIS esclusa l'Ucraina stimato come percentuale del mercato CIS complessivo: il 95,6% nel 2008; il 95,2% nel 2009, il 95,9% nel 2010, il 94,7% nel 2011 e il 95,5% nel 2012. 2011-2014: anno solare.
Figure refers to the CSI market, not including Ukraine estimated as a percentage of the overall CIS market: 95,6% of the market in 2008; 95,2% in 2009, 95,9% in 2010; 94,7% in 2011 and 95,5% in 2012. The period over which data was collected regarded 52 weeks, from November one year to November the next. 2011-2014: calendar year.
Turkey: Dal 2011 fonte Antrakt Sinema Gazetesi che rileva i dati su base settimanale.
From 2011 onwards the source is Antrakt Sinema Gazetesi, which collects data on a weekly basis.
Quote di mercato dei film nazionali (coproduzioni incluse) (2007-2015)
Market shares of domestic films (incl. co-productions) (2007-2015)
© copyright MEDIA Salles
Whilst publishing the latest statistics and announcing the presentation of the new DiGiTalk, to take place on 13 February in Berlin, MEDIA Salles remembers Dr Joachim Ph. Wolff, who left us on 10 January 2016 in his home at Bilthoven (NL). It was thanks to Dr Wolff, a founding member of MEDIA Salles and for several years an Executive Committee Member and Treasurer, that MEDIA Salles' work on research and information was launched and continued to benefit from his passion and professional competence.
For further information:
Elisabetta Brunella, Secretary General
MEDIA Salles - Piazza Luigi di Savoia 24 - I - 20124 Milano
tel: +39 02 6739781 - fax: +39 02 6690410 - e mail: press@mediasalles.it
www.mediasalles.it
cell phone during the Berlinale: +39 349 2699141