|
|
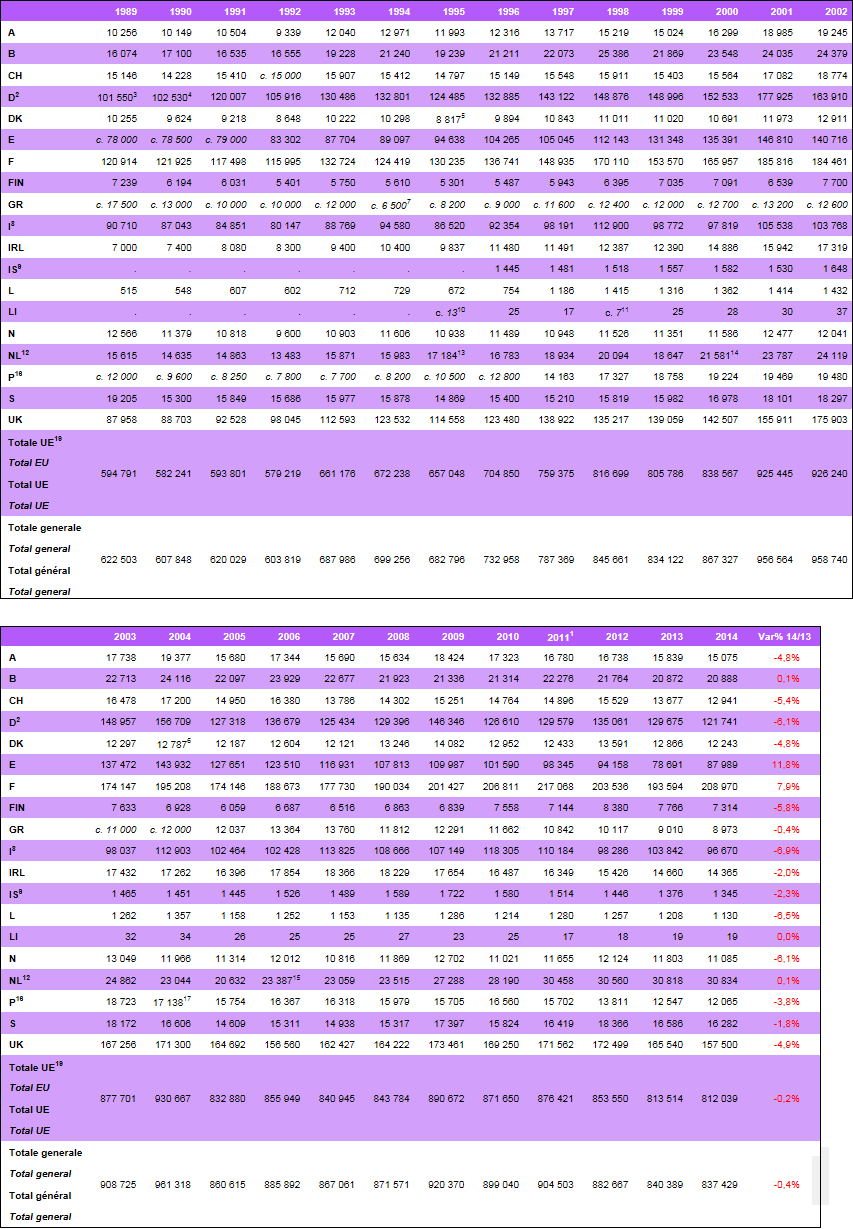
Presenze (1989-2014)
|

© copyright MEDIA Salles
1) Il dato del 2011 si riferisce a 52 settimane dal 30/12/2010 al 29/12/2011 per i seguenti Paesi: Grecia, Paesi Bassi, Regno Unito, Svezia, Svizzera e Liechtestein.
The 2011 figure refers to 52 weeks from 30/12/2010 to 29/12/2011 for the following countries: Greece, Netherlands, United Kingdom, Sweden, Switzerland and Liechtenstein.
2) Inclusi i cinema municipali.
Including municipal cinemas.3) Solo Repubblica Federale di Germania.
Old BRD only.4) Idem.
5) Questo dato si riferisce a 53 settimane di programmazione.
This figure refers to 53 screening weeks.6) Idem.
7) Questo dato si riferisce ad un periodo di soli 9 mesi: settembre 1994 - maggio 1995.
This figure only concerns a period of nine months: September 1994 - May 1995.8) Relative agli schermi operanti per più di 60 giorni l'anno. Le presenze relative al totale degli schermi (esclusi arene e ambulanti) erano 96 448 505 nel 1996; 102 566 523 nel 1997; 118 425 865 nel 1998; 103 483 150 nel 1999; 103 367 832 nel 2000; 109 535 939 nel 2001; 114 805 678 nel 2002; 109 312 788 nel 2003; 115 845 480 nel 2004; 104 689 099 nel 2005; 103 931 247 nel 2006; 115 467 872 nel 2007; 109 857 051 nel 2008; 108 263 184 nel 2009; 120 192 276 nel 2010; 112 119 910 nel 2011; 99 412 919 nel 2012;
105 039 259 nel 2013; 97 657 890 nel 2014.
Relevant to screens with more than 60 days of activity per year. The total admissions relevant to all screens (not including arenas and travelling screens) were 96 448 505 in 1996; 102 566 523 in 1997; 118 425 865 in 1998; 103 483 150 in 1999; 103 367 832 in 2000; 109 535 939 in 2001; 114 805 678 in 2002; 109 312 788 in 2003; 115 845 480 in 2004; 104 689 099 in 2005; 103 931 247 in 2006; 115 467 872 in 2007; 109 857 051 in 2008; 108 263 184 in 2009; 120 192 276 in 2010; 112 119 910 in 2011; 99 412 919 in 2012;
105 039 259 in 2013; 97 657 890 in 2014.9) 1996-2010: fonte Hagstofa Íslands; 2011-2012: fonte SMAIS-The Association of film rights-holder in Iceland; 2013-2014: fonte Icelandic Film Centre.
1996-2010: source Hagstofa Íslands; 2011-2012: source SMAIS-The Association of film rights-holder in Iceland; 2013-2014: source Icelandic Film Centre.10) Dati parziali.
Partial data.11) Idem.
12) Questo dato si riferisce a 53 settimane di programmazione.
This figure refers to 53 screening weeks.13) Idem.
14) Queste cifre non includono i dati relativi ad alcuni piccoli distributori. Nel 2003 le presenze complessive sono circa 25 000 000.
These figures do not include data on some small distributors. In 2003 total admissions were around 25 000 000.15) Questo dato si riferisce a 53 settimane di programmazione.
This figure refers to 53 screening weeks.16) 2001 - 2003 INE
2004 - 2014 ICA17) Le presenze secondo INE, comprendente anche le sale polivalenti, sono 18 880 000.
Admissions according to INE, which include polyvalent theatres, are 18 880 000.18) Le presenze secondo INE, comprendente anche le sale polivalenti, sono 17 165 000.
Admissions according to INE, which include polyvalent theatres, are 17 165 000.19) I dati riguardanti Austria, Finlandia e Svezia sono inclusi dal 1989.
Data on Austria, Finland and Sweden have been included since 1989.